A sunny region does not automatically have dependable electricity, and a country with large fuel reserves may still import energy. The missing pieces are often connections, conversion, timing, and access. Energy geography brings those pieces together instead of treating a resource map as a complete explanation.
Energy geography studies where energy resources, production facilities, networks, and demand are located, and how they connect. It examines why supply and use differ between places, how energy moves, and who benefits or bears costs. Resources, reserves, installed capacity, and actual energy output describe different parts of that system.
1. What energy geography studies
Energy geography is a field of study, not a particular location. Within the broader subject of geography, it follows the spatial relationships between energy and people. It connects physical conditions, such as geology and climate, with human decisions about investment, settlement, technology, and trade. A useful question is not simply “Where is the coal or sunshine?” but “How can energy reach a particular user, at what time and cost?”
Its subject is wider than electricity. Transport fuels, industrial heat, cooking, and building heating also have geographies. Electricity is an energy carrier produced from other sources; a map of power plants therefore cannot stand in for a map of every kind of energy use. The subject overlaps with economic geography when it examines industry, infrastructure, and regional connections.
Scale changes the question. A household may need affordable, reliable service; a city may need new distribution capacity; a country may examine dependence on imported fuel. Those concerns can coexist, but a favorable national total does not tell us whether every neighborhood receives dependable service. The U.S. Department of Energy’s LEAD tool, for example, compares housing energy costs and their share of household income across places. That is a different question from how much energy a region produces.
2. Resources and demand occur in different places
Fuel deposits reflect geological history; solar and wind resources reflect environmental conditions. Demand is shaped by where people live, what industries operate, and how buildings and transport systems use energy. Supply and demand need not occupy the same place. Connections between them may cross several administrative borders.
Keep the measurements separate
| Measure | Meaning | Reading caution |
|---|---|---|
| Resource | A broader physical energy endowment or flow | Check which resource and assessment method are meant. |
| Proved reserves | Estimated recoverable quantities under specified economic and operating conditions | Not everything underground, and not this year’s extraction. |
| Production | Fuel extracted or energy produced during a stated period | State the commodity and period; barrels per day are not barrels remaining. |
| Generating capacity | Potential electrical output under specified conditions, usually MW or GW | Not the amount actually generated during a year. |
| Electricity generation | Electricity produced over a period, usually MWh or GWh | Check whether figures are gross or net of plant use. |
| Consumption | Energy used within a stated boundary and period | Specify electricity versus all energy and which users are included. |
Reserves are not fixed simply by drawing a geological boundary. EIA’s explanation of natural-gas reserves shows why new information, technology, prices, and costs can change recoverable estimates. A reserve figure therefore needs a definition and date, not just a country name.
For electricity, EIA distinguishes capacity from generation. As a purely arithmetic example, a 2 MW generator running at full output for three hours produces 6 MWh. This does not predict any real plant’s operation: weather, maintenance, fuel availability, and system needs can change output.
3. Fuel routes and electricity networks
Trace the connections, not just the resource
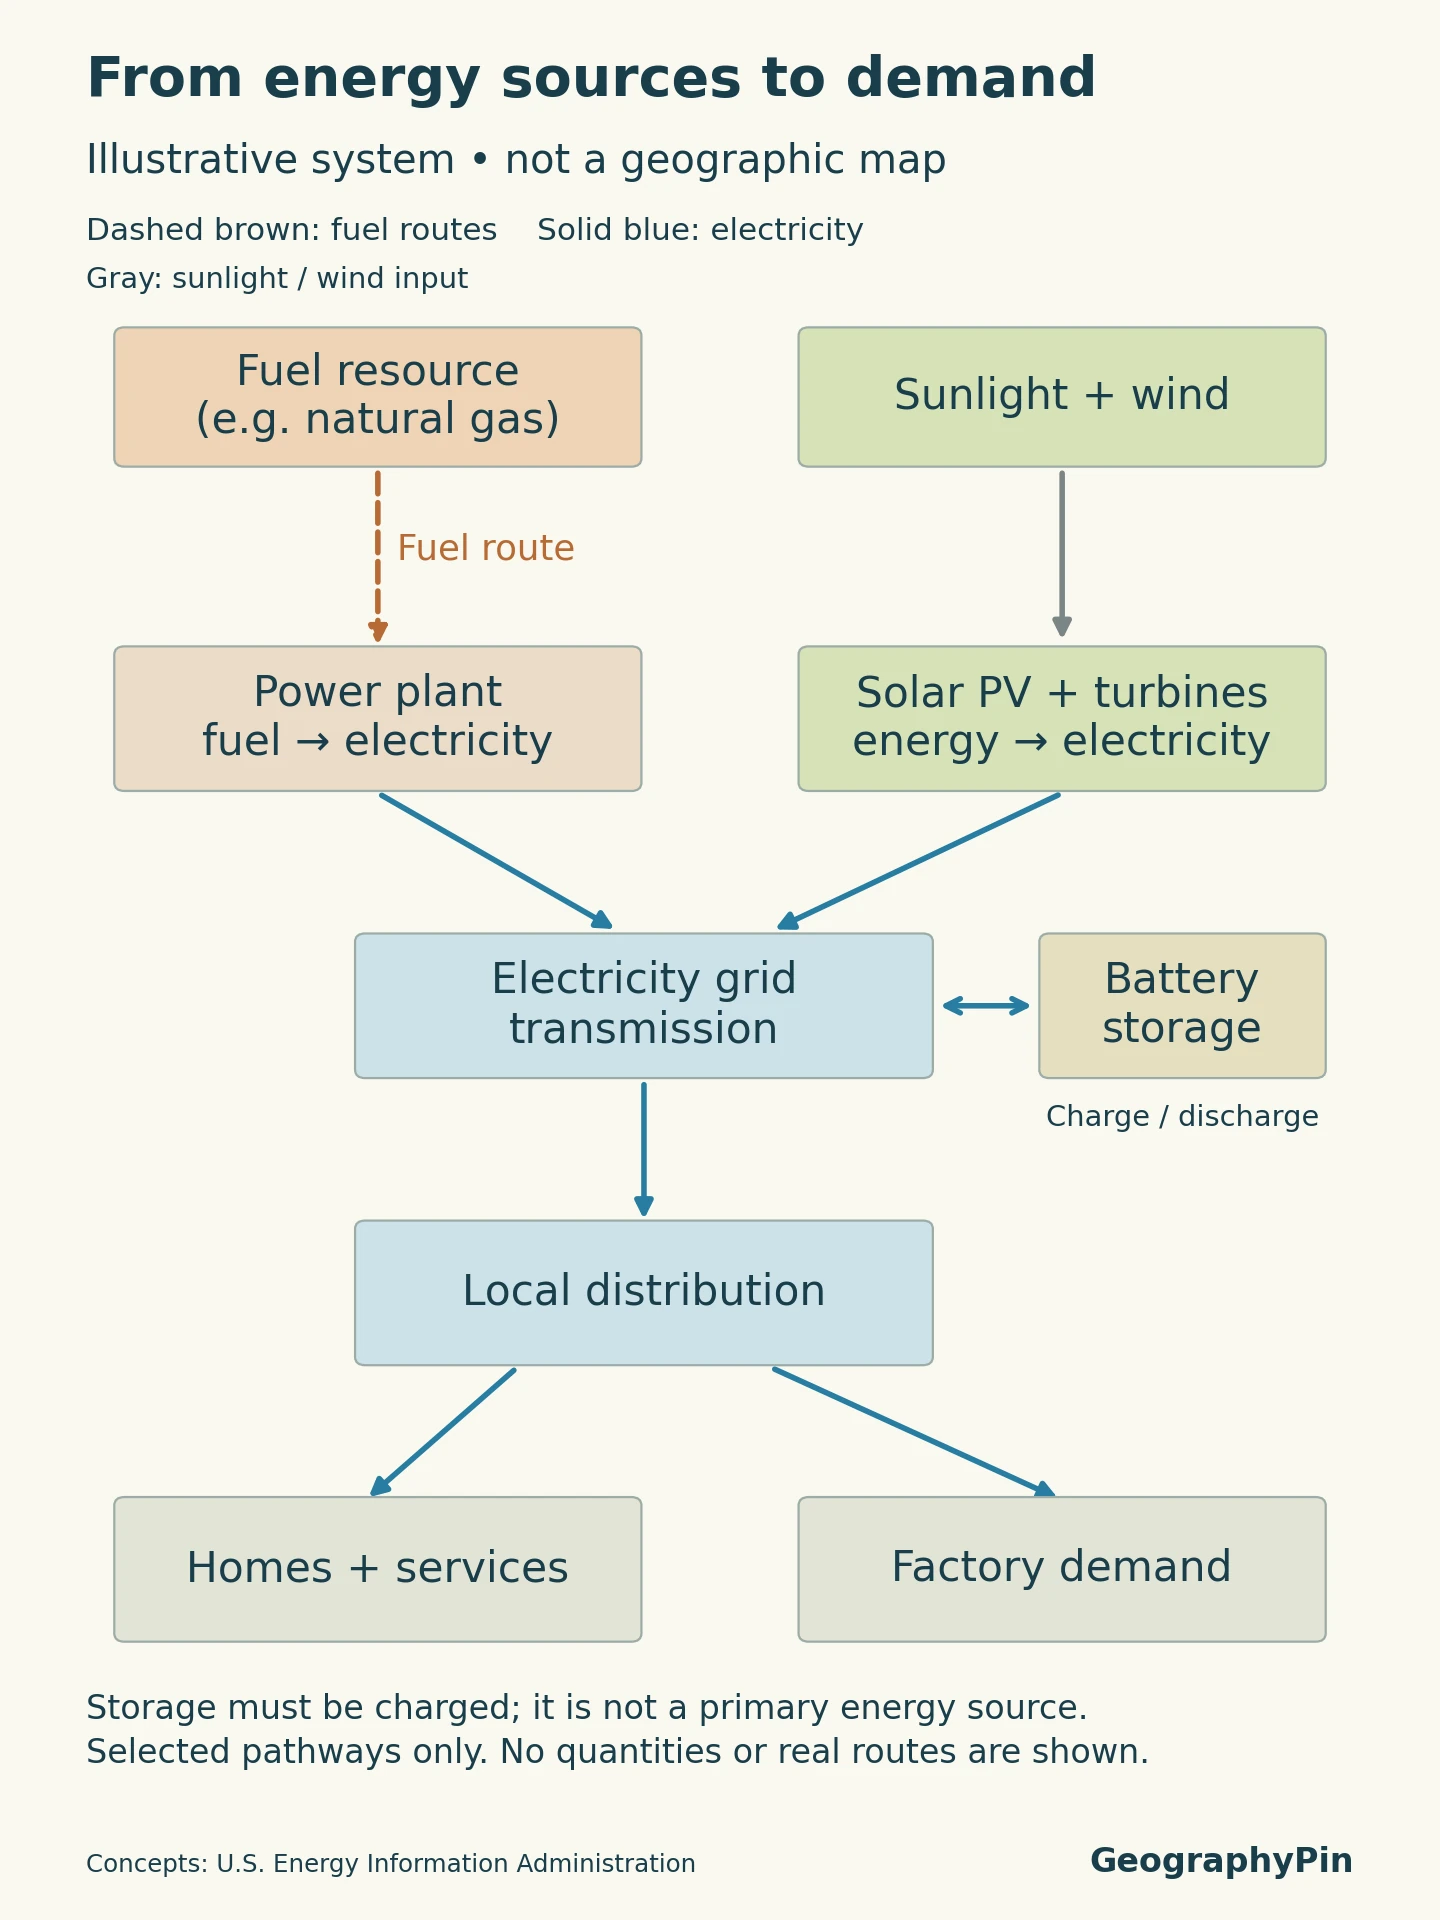
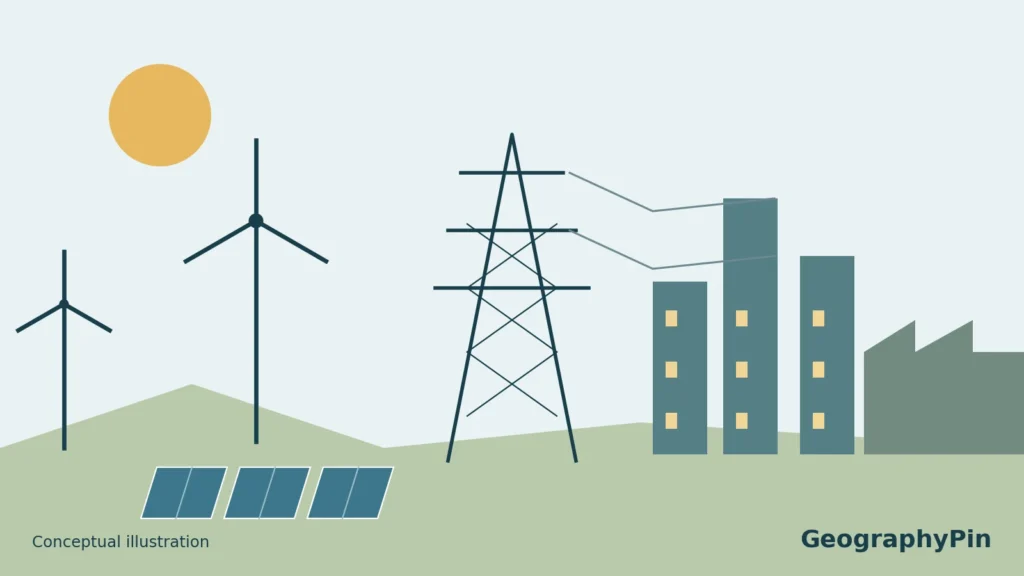
Fuel can move before it is converted into useful energy. EIA explains the transport systems for coal and liquefied natural gas. Coal may travel by rail or ship; natural gas may move through pipelines, or as liquefied natural gas carried by ship between specialized terminals. Those routes have physical facilities and constraints. A deposit symbol alone says little about the ability to deliver fuel to a particular user. The diagram shows selected electricity pathways, not all energy uses: fuels can also supply transport and heating directly, and some industries connect directly to transmission.
Electricity follows a different network. EIA describes transmission, substations, transformers, and local distribution as connected parts of delivery. Interconnections allow regions to exchange power, but transfer capability is finite. A line on a map does not prove that spare capacity is available when needed.
Battery storage adds another distinction: its power rating describes how quickly it can deliver energy, while its energy rating describes how much it can store. A battery must first be charged and incurs losses. It is not an independent primary energy resource, as EIA’s storage guide explains.
4. Renewable potential is not actual output
From natural conditions to usable supply
A wind-speed or sunlight map describes a resource, not a guarantee that a power project can be built or will supply a stated amount of electricity. Technology, terrain, land availability, network access, cost, and environmental or social constraints change what can be developed.
A 2023 review of renewable-electricity potential distinguishes technical potential from economic and feasible potential. Technical estimates account for technology and geographical limits; economic estimates additionally consider cost; feasibility also considers societal and environmental constraints. Different assumptions can produce very different estimates.
Read the legend and method before comparing maps. Is the shading a long-term average resource, an estimate of possible generation, or recorded output from operating plants? Does it describe a whole grid cell or a suitable site within it? Averaging can hide seasonal and hourly variability, so an attractive annual resource does not by itself establish dependable supply at every hour.
5. California: one region, several energy connections
California illustrates why one resource layer is insufficient. In the California Energy Commission’s 2025 total-system electric-generation account, supply combines in-state generation with net imports. The reported mix includes solar, gas, hydroelectricity, wind, nuclear, and other sources, with imports from the Northwest and Southwest.
That account concerns utility-scale electricity and net imports, not every form of energy used in California or all rooftop generation. Its annual totals also do not describe the availability of power during a particular evening. The Commission notes that hydrological conditions in the Pacific Northwest affected electricity available for import in 2025.
The same region changes through the day
In a historical explanation of its evolving system, the California Independent System Operator describes the “duck curve”: abundant daytime solar can lower the demand left for other generators, while that remaining demand rises as solar fades. Storage, flexible supply, changes in demand, and exchanges with neighboring systems help manage the timing problem. CAISO’s operating area is not identical to the entire state.
The geographic lesson is to follow both connections and time. A useful assessment needs resource conditions, operating facilities, network constraints, and demand patterns together. California’s annual import balance does not mean power always flows in one direction; nor does strong sunshine alone establish whether an individual community has affordable, reliable service.
6. How to read an energy map or table
Before using an energy map to compare places, check these five things:
- Boundary: Is it a country, state, balancing area, grid connection, or project site?
- Measure: Is the symbol showing resources, capacity, generation, or consumption?
- Period: Is the value instantaneous, daily, annual, or a long-term average?
- Coverage: Are imports, small installations, losses, and plant electricity use included?
- Assumptions: Does the map represent observed conditions or modeled potential?
These checks prevent misleading rankings. Two regions can have the same installed capacity but different generation; a major producer can also be an importer; and a high-resource location can remain poorly connected. Comparing like with like is more useful than selecting the largest number on the map.
Common questions
Does renewable mean an energy project has no environmental impact?
No. Renewable describes the source’s replenishment, not an absence of impacts. Land, ecosystems, materials, water, and nearby communities still matter when assessing a particular project.
Can rooftop solar change energy geography?
Yes. Generation can occur close to users rather than only at large remote plants. That changes the role of local networks, but does not remove the need to match production and use over time.
What Did We Learn Today?
Energy geography connects resources, facilities, networks, and people. Reserves are not production, capacity is not generation, and renewable potential is not guaranteed supply. Following where energy moves and when it is needed reveals more than a resource map or annual total alone.
Sources & Data Notes
The schematic shows conceptual relationships, not actual routes, boundaries, capacities, or energy quantities. The California example uses a dated 2025 electricity account and the system operator’s explanation of daily balancing; it is not a forecast or a claim about current grid conditions. The arithmetic example illustrates units only.
- EIA: Proved energy reserves. Recovery conditions and reserve definitions.
- EIA: Natural-gas reserves and resources. Why estimates can change.
- EIA: Capacity and generation. Power, energy, and plant output.
- EIA: Electricity delivery. Transmission and distribution networks.
- EIA: Electricity storage. Charging, losses, and different storage ratings.
- Angliviel de La Beaumelle and colleagues (2023). Technical, economic, and feasible renewable-electricity potential.
- California Energy Commission: 2025 total-system generation. Annual regional supply and reporting scope.
- California ISO: Our evolving grid. Daily net load and regional exchanges.