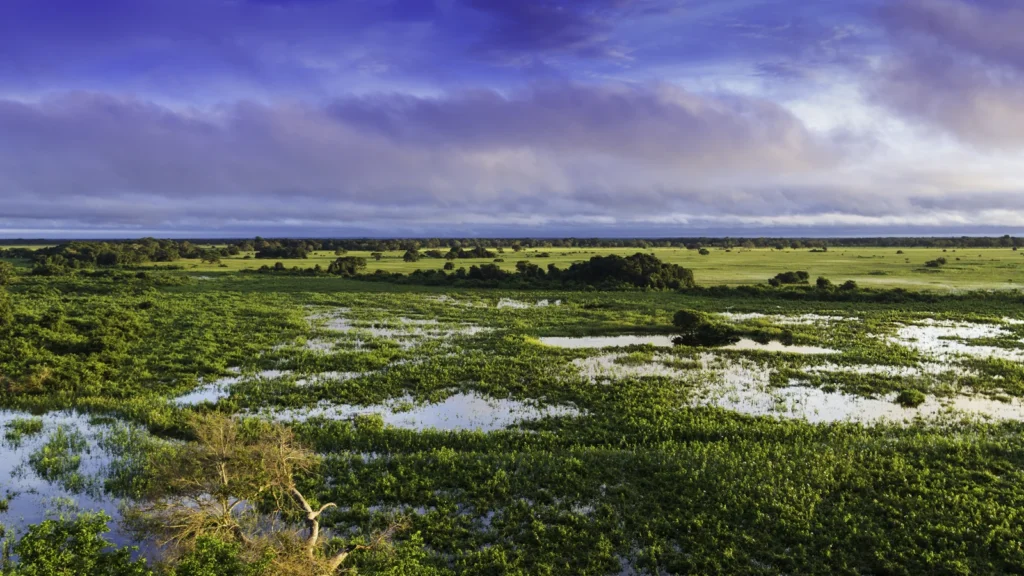
A patch of grassland in the Pantanal can be dry in one season and covered with shallow water in another. A map of the whole region still includes both versions of that landscape. The changing waterline is part of what makes it a wetland.
The Pantanal is the broad tropical floodplain of the upper Paraguay River and its tributaries in central South America. Most of it lies in western Brazil, with wetland landscapes extending into eastern Bolivia and northern Paraguay. Its floodplain is smaller than the drainage basin that feeds it, and the area covered by water changes with the seasons.
How to use this article: Start with the mapped ecoregion, follow how water reaches the floodplain, or compare six dates of average peak river level.
The Pantanal on a map
Two ways to map the same landscape
The flat, seasonally flooded lowlands along the Paraguay River are the core of the Pantanal. The green area on the map is the Pantanal ecoregion in the 2017 RESOLVE global classification. It is a regional ecological footprint, not a picture of the ground under water on one date. Brazil’s 2025 national biome map, published separately by IBGE, answers a different question. It identifies the Brazilian Pantanal within a national system; its coverage stops at Brazil’s borders, not at the edge of cross-border wetland habitat.
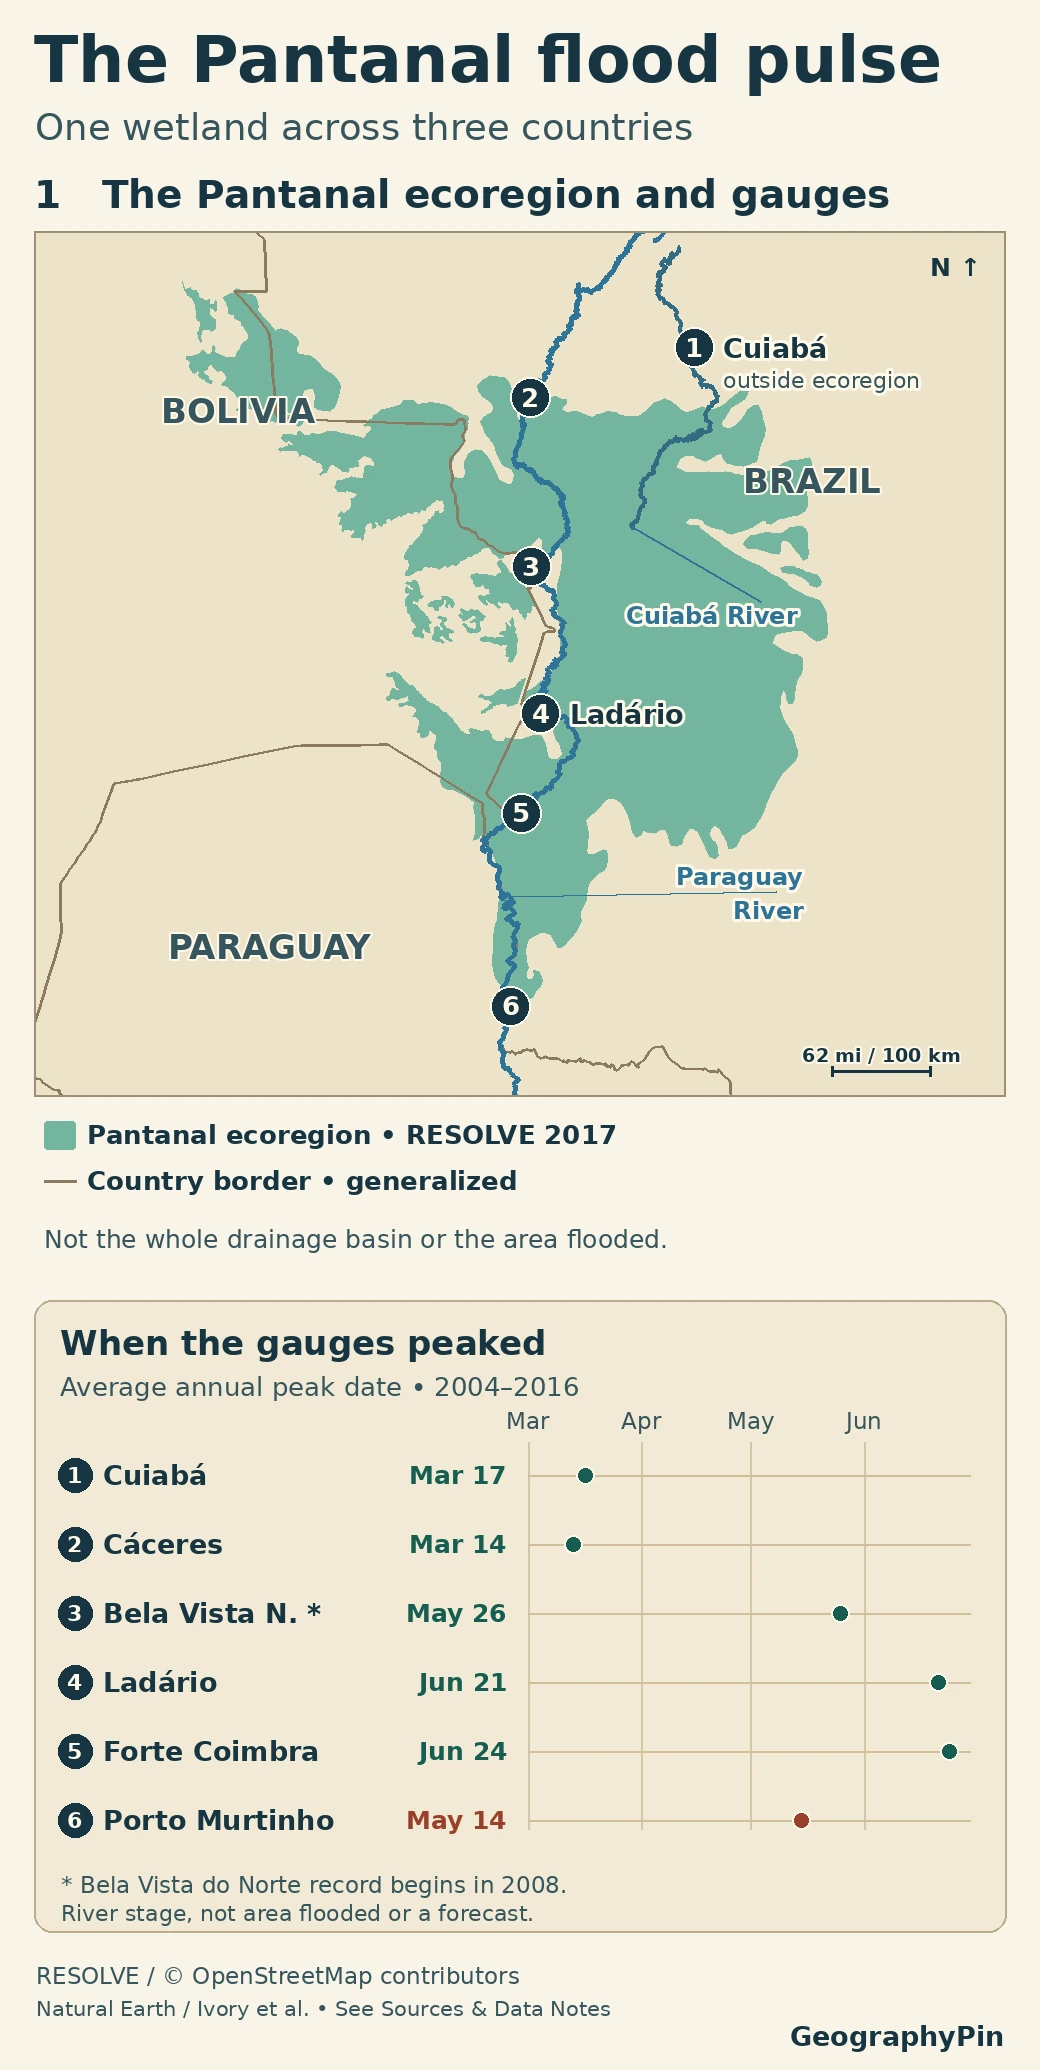
The city of Cuiabá, marked 1, is a good edge case. The gauge on the city’s river is outside the ecoregion shown here, but the Cuiabá River itself flows down into the wetland. A place can be directly connected to the Pantanal without its city center or its entire municipality lying in the mapped lowlands. The gentle transition toward the Cerrado makes that distinction easy to miss.
How the upper Paraguay basin feeds the wetland
The basin includes higher land that drains toward the floodplain. Water can fall as rain on the uplands, enter streams, and reach the wetland later through tributaries such as the Cuiabá, Taquari and Miranda. The lowlands receive direct rainfall as well. On this very gently sloping ground, the same river system can hold water in fields, lakes and side channels long after rainfall has peaked.
Why water spreads away from the main river
On a rising river, water can leave the channel and move along smaller channels or across low ground. Local rain can also collect in shallow depressions. Water can therefore spread across a field far from the Paraguay River without having flowed over the nearest main-river bank. Slightly raised ground may remain dry while nearby hollows fill. When levels recede, pools and some side channels can stay wet even after much of the floodplain is exposed.
When the flood pulse reaches different rivers
A March peak upstream, a June peak at Ladário
Ivory and colleagues used Brazil’s National Water Agency river-stage records to compare the average day of the annual high at six gauges. Cáceres and Ladário are both on the Paraguay River. In the study, their average peaks were March 14 and June 21, respectively, about three months apart. The southernmost station in the comparison, Porto Murtinho, peaked on average in May, earlier than Ladário and Forte Coimbra. The pattern is not a simple timetable that shifts by the same amount at every bend.
Open the six historical peak dates
| Gauge | River | Average peak |
|---|---|---|
| Cuiabá | Cuiabá | March 17 |
| Cáceres | Paraguay | March 14 |
| Bela Vista do Norte | Paraguay | May 26 |
| Ladário | Paraguay | June 21 |
| Forte Coimbra | Paraguay | June 24 |
| Porto Murtinho | Paraguay | May 14 |
These dates summarize levels measured at the stations. They do not give the flood’s maximum surface area, its depth across the plain or the current water level. Nor does the gap between the dates measure how long one parcel of water took to travel from Cáceres to Ladário.
Brazilian, Bolivian and Paraguayan sectors
Brazil. The lowlands occupy parts of Mato Grosso and Mato Grosso do Sul. See the geography of Brazil for how the Pantanal relates to the country’s other biomes and drainage systems. On this map, Cáceres marks the upper end of the gauge comparison and Ladário sits farther south beside the Paraguay River.
Bolivia. The wetland landscape continues into the eastern department of Santa Cruz along the Brazilian frontier. The Ramsar listing for El Pantanal Boliviano gives one way of finding a large named wetland there, but that designation is not the regional outline used on the map.
Paraguay. A smaller sector reaches the far north of the country along the Paraguay River. The Río Negro Ramsar site near Bahía Negra lies in a transition where the Pantanal and Chaco meet. Nearby drier Chaco landscapes should not all be swept into a single Pantanal polygon.
Which boundary suits which question?
- Where are the landscapes usually grouped as Pantanal? Use an ecological map with a stated definition. The RESOLVE layer shows one cross-border convention, while IBGE is useful when comparing biomes within Brazil.
- Where can incoming water come from? Use a drainage-basin map. That line follows the divides around the land from which water drains, not just the edge of the flat wetland.
- Which ground was flooded at a particular time? Use dated inundation mapping for that footprint and season. A single satellite image may also miss water under vegetation or beyond its frame.
Even two valid flood maps will not match if one is made near the high-water season and the other after the water has receded. Check the date and what was actually mapped before treating the difference as a long-term change.
Frequently Asked Questions
Can the Paraguay River read below zero on a gauge?
Yes. A gauge measures height relative to a fixed local reference, not depth from the riverbed. A reading below zero means the surface fell below that mark, not that the channel ran out of water.
Is the Pantanal part of the Amazon basin?
No. The Paraguay River flows into the Paraná River, in the Río de la Plata drainage system. Both landscapes extend into Brazil, but they drain to the Atlantic through different river systems.
Does the Pantanal stop at its national park?
No. Brazil’s Pantanal Matogrossense National Park covers only part of the wetland. The UNESCO Pantanal Conservation Area includes the park and adjoining private reserves. That property is a protected part of the Brazilian Pantanal, not its ecological boundary or a cross-border designation.
What Did We Learn Today?
The Pantanal is a floodplain within a larger basin. Its ecological boundaries depend on the map, while water rises and recedes at different times in different parts of the river system. Follow the legend for extent and the gauges for timing.
Sources & Data Notes
Open sources and map method
The regional map shows the cross-border ecoregion, not an inundation footprint, protected area or legal parcel boundary. The official Brazilian biome map is linked for comparison and is not reproduced. Gauge dots are approximate at this scale. The chart transcribes the paper’s average peak dates; it does not derive them from the map or compare gauge heights.
- Dinerstein et al., An Ecoregion-Based Approach to Protecting Half the Terrestrial Realm (2017) and RESOLVE Ecoregions 2017, Pantanal feature 584, CC BY 4.0, adapted. IBGE, separate 2025 Brazilian biome map, 1:250,000. Generalized international line: Natural Earth v5.1.2, public domain. River linework: © OpenStreetMap contributors, ODbL, via WaterwayMap’s Paraguay and Cuiabá traces. Download the map’s two river lines and license notice (ZIP).
- Ivory et al., Vegetation, rainfall, and pulsing hydrology in the Pantanal (2019), Methods, Results and Figure 3, using ANA station records. ANA station location context; ANA’s November 12, 2025 monitoring bulletin for examples of stage values and gauge references. The chart is drawn from published date values; the original figure is not reproduced.
- Embrapa’s upper Paraguay basin mapping project and Cuiabá valley natural geography for the upland and lowland transition; Field study of the confluence of the Cuiabá and Paraguay rivers; ANA’s mapped overflow points and connected flood areas; Paraguay–Paraná drainage description, section 2.4.
- Ramsar Sites Information Service, El Pantanal Boliviano, site 1089 and Río Negro, site 729; UNESCO Pantanal Conservation Area.
- Featured image: Pantanal, Mato Grosso, Brasil by Filipefrazao, CC BY-SA 3.0, cropped and resized; the image adaptation uses the same license. The photograph is not an observation at a numbered gauge.
