“Largest” can mean the widest water surface or the greatest amount of water. Those measures give different leaders among Africa’s major freshwater lakes, so the useful comparison names the metric before naming the winner.
Victoria, Tanganyika and Malawi are Africa’s three largest natural freshwater lakes by surface area in HydroLAKES v1. By volume, the same lakes rank Tanganyika, Malawi, then Victoria. This comparison counts each whole lake once and uses one reference compilation, not a synchronized present-day survey or a complete top-ten list.
How to use this article: Check the inclusion rules, compare the volume order, or interpret the source dates.
1. What This Ranking Includes
Three natural lakes, counted once each
The main ranking uses surface area: the extent of the water surface, not the surrounding catchment. It covers the three largest natural freshwater lakes in the reference dataset, then reorders that same group by volume. It is not a complete top-ten list.
- Whole lakes: a lake shared by several countries occupies one row, not one row per country.
- Natural origin: regulation does not exclude a natural lake. Victoria remains included; artificial reservoirs belong to a separate comparison.
- Consistent figures: both tables use HydroLAKES v1, rather than selecting a different preferred source for each lake.
USGS defines freshwater as containing less than 1,000 milligrams per liter of dissolved solids. This is a classification convention, not a claim that these lakes have just undergone identical water-quality testing. “Freshwater” also does not mean untreated water is safe to drink.
The lake definition and classification guide explains the broader differences between lakes, reservoirs and other inland waters.
2. The Three Largest by Surface Area
| Area rank | Lake | Surface area | Shore countries |
|---|---|---|---|
| 1 | Victoria | About 25,933 sq mi (67,166 km²) | Kenya, Tanzania, Uganda |
| 2 | Tanganyika | About 12,674 sq mi (32,827 km²) | Burundi, Democratic Republic of the Congo, Tanzania, Zambia |
| 3 | Malawi / Nyasa / Niassa | About 11,407 sq mi (29,544 km²) | Malawi, Mozambique, Tanzania |
Scanning the dataset’s African records places these three first even before excluding saline waters and reservoirs. In this source, Victoria has roughly twice Tanganyika’s surface area. That comparison describes their mapped footprints, not how much water they hold.
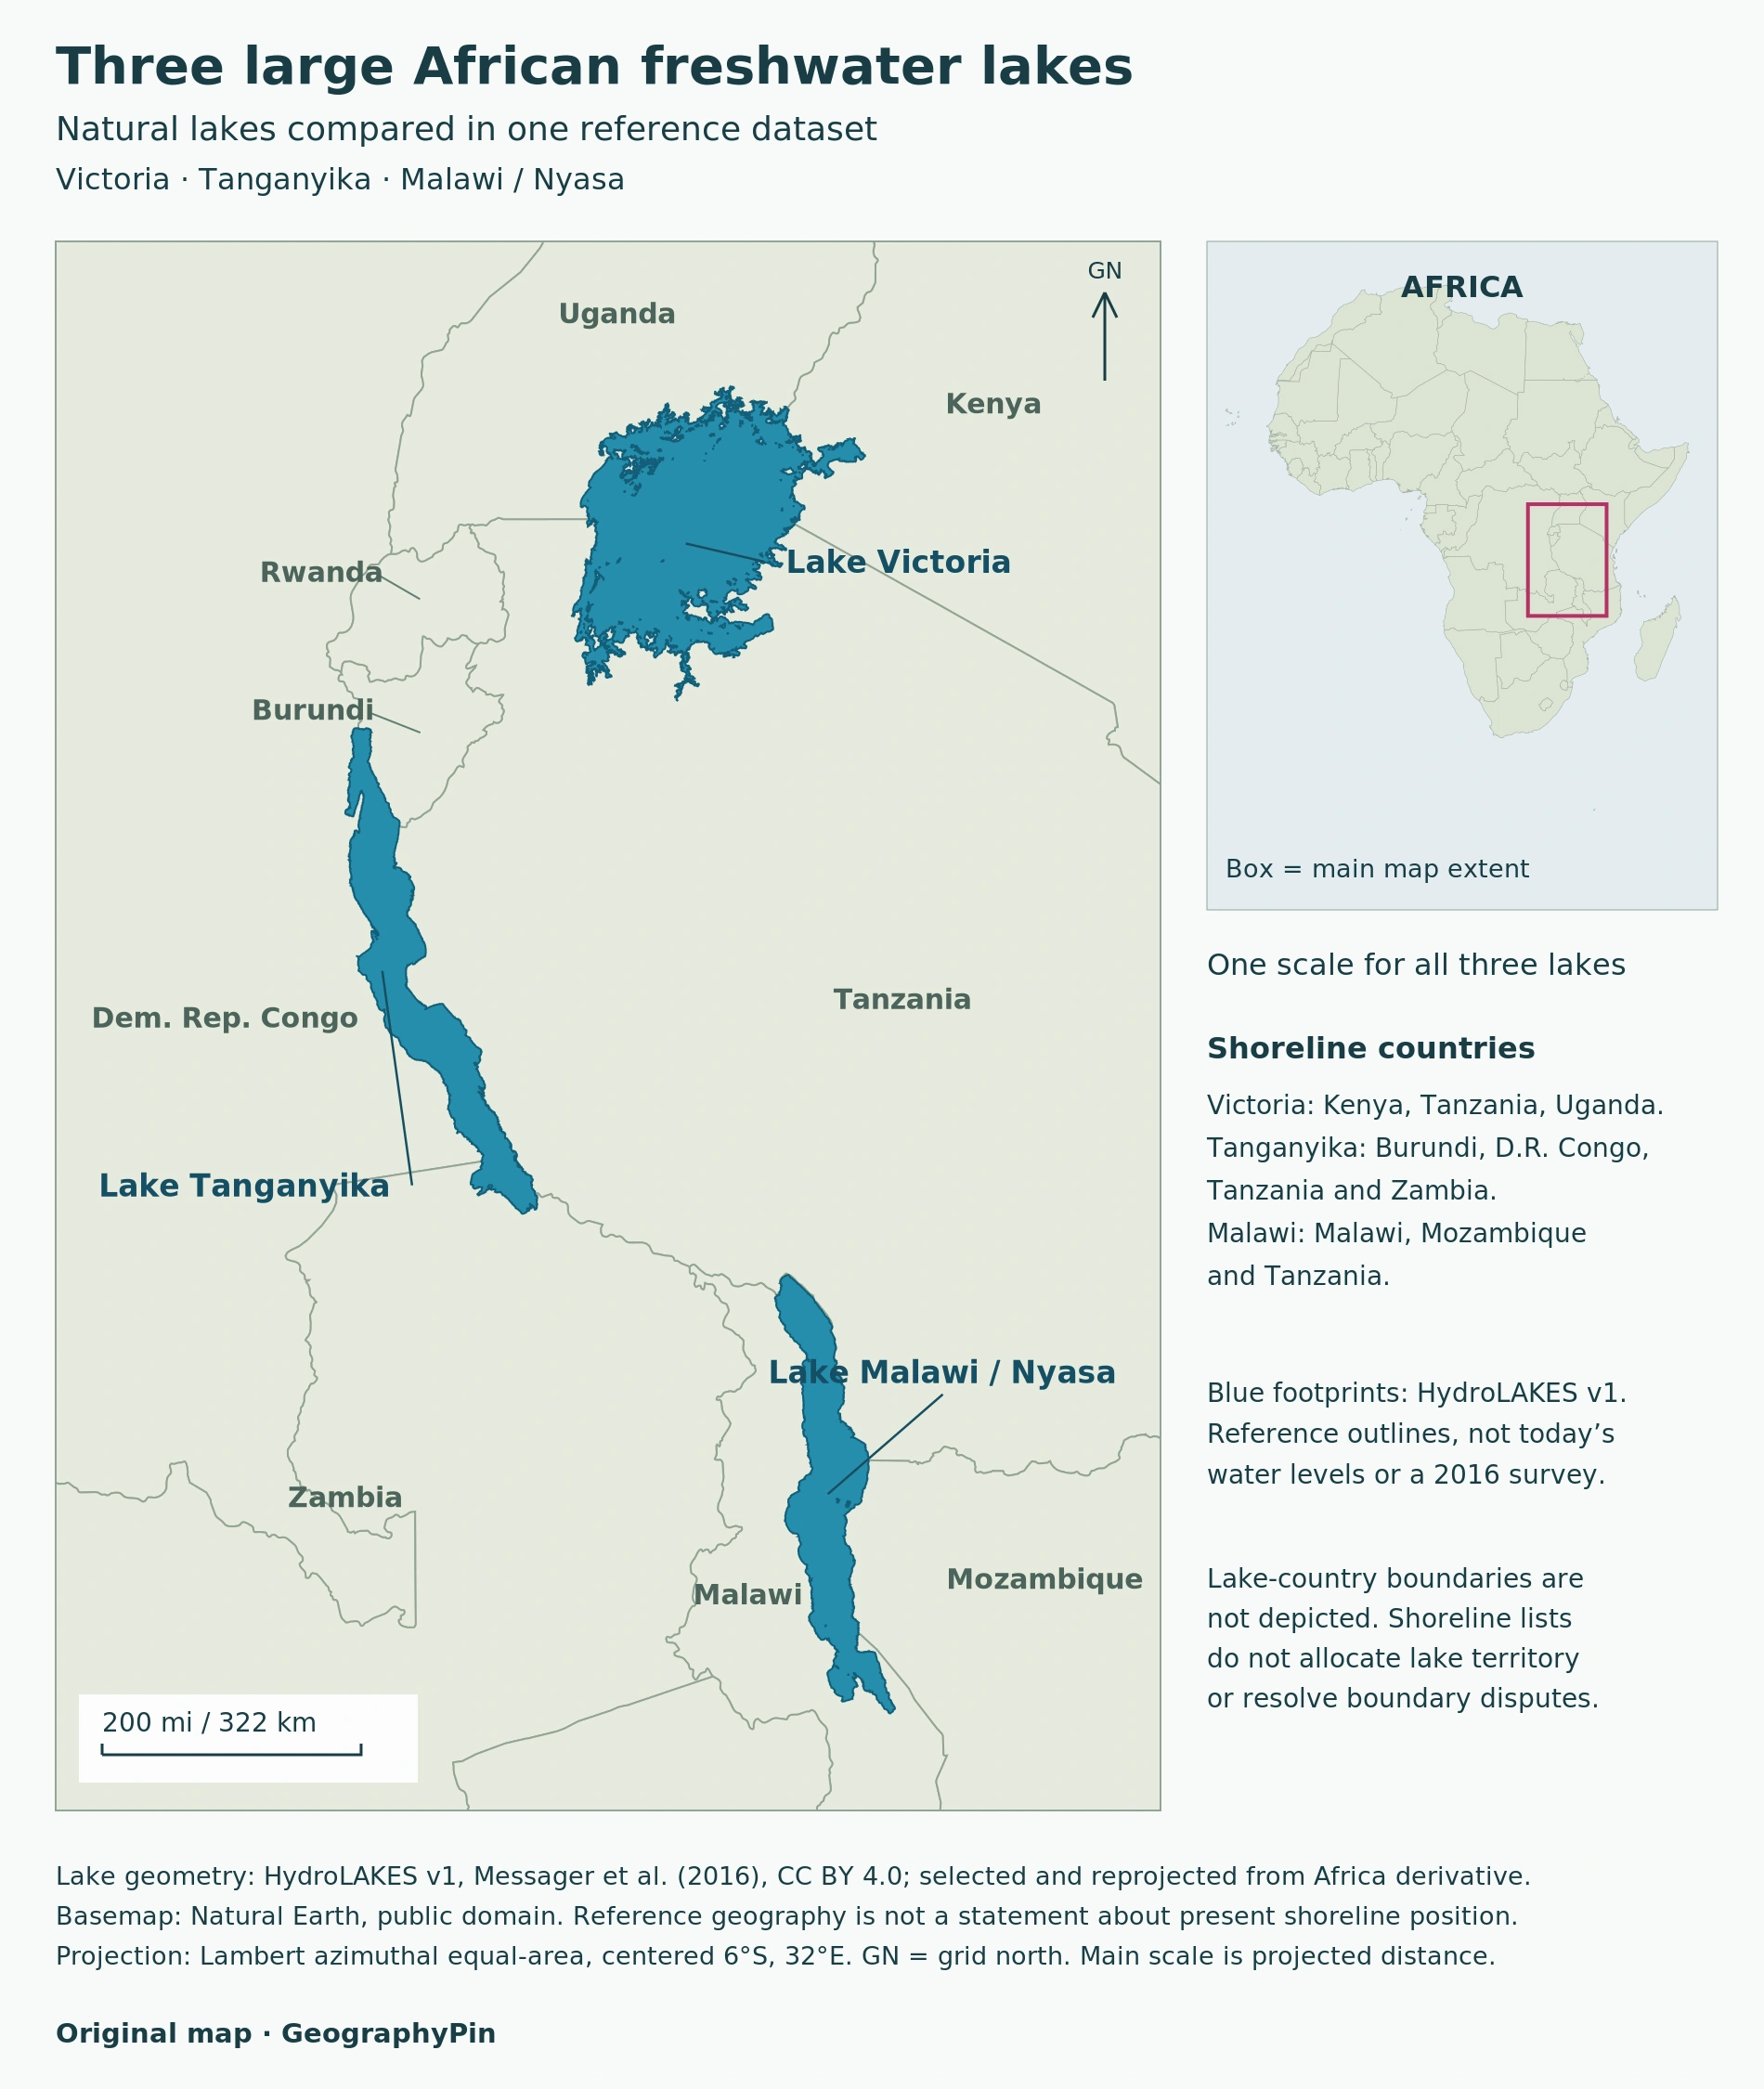
Country lists describe the states adjoining the lakes, using LVFO for Victoria and FAO accounts for Tanganyika and Malawi/Niassa/Nyasa. They are not allocations of lake ownership or rulings on disputed boundaries.
HydroLAKES’ single “Country” field refers to the lake’s outlet location, not every shore country. It is therefore not used as the country list in this table.
3. Volume Changes the Order
The same three lakes, measured in three dimensions
| Volume rank | Lake | Total volume | Area rank |
|---|---|---|---|
| 1 | Tanganyika | About 4,544 cu mi (18,940 km³) | 2 |
| 2 | Malawi / Nyasa / Niassa | About 1,852 cu mi (7,720 km³) | 3 |
| 3 | Victoria | About 662 cu mi (2,760 km³) | 1 |
Tanganyika moves to first place, Malawi to second and Victoria to third. Using the unrounded source values, Tanganyika contains about 6.9 times Victoria’s volume, despite having less than half its surface area.
The reason is geometric: volume depends on the basin below the surface, not just its outline. A broad, comparatively shallow lake can cover more ground than a narrower, deeper lake while holding much less water.
This table does not rank maximum depth. Nor does total volume mean the quantity that can be withdrawn sustainably, treated economically or supplied as drinking water. Those are different questions requiring different evidence.
4. What the Source Dates Mean
A reference compilation is not a synchronized survey
HydroLAKES v1 documentation is dated December 2016. Its outlines and volume estimates combine sources from different dates; all three displayed volumes are literature-based records. The year labels the compilation, not a simultaneous measurement of the lakes.
The table rounds converted values to whole square or cubic miles, followed by whole metric units. Retaining extra digits would make the display look more precise without improving the observations.
Download the three-lake comparison CSV. Data adapted from HydroLAKES v1, Messager et al. (2016), under CC BY 4.0; selected, converted and ranked by GeographyPin.
The comparison CSV retains the original metric area and volume values, lake identifiers, calculated U.S. units, both ranks, shore-country sources and scope notes. It is a three-record derivative, not a complete African lake inventory.
A different reference can legitimately give a different area. A change between two published numbers is not automatically a measured expansion or contraction: first compare shoreline definitions, methods and observation dates. The linked lake profiles provide individual context without silently replacing rows in this common-source comparison.
5. Why Other Lake Names Need Care
African Great Lakes is not synonymous with freshwater-only lakes. UNESCO describes Lake Turkana as saline. Its inclusion in a regional lake grouping does not make it eligible for a freshwater ranking.
Reservoirs answer another question. This comparison excludes lakes created by dams rather than extending the natural-lake list with artificial storage. A regulated natural lake such as Victoria is retained because regulation and origin are not the same classification.
Lake Chad needs a dated footprint. NASA’s June 2025 account, discussing a January 2025 photograph, distinguishes surviving waters, wetlands and former lakebed. It documents a major decline from the mid-twentieth-century extent, not a uniform shoreline measurement that can simply be inserted as a permanent fourth place.
Seasonal and longer-term water-level changes affect lake area and volume. A reproducible comparison must say which water surface it measures, rather than treating every historical outline, wetland extent and recent open-water estimate as interchangeable.
Frequently Asked Questions
Are Malawi, Nyasa and Niassa separate lakes?
No. These names refer to the same lake. It occupies one row, not three, regardless of which regional name a source uses.
Does a country’s lake basin equal its share of the lake?
No. A catchment includes land draining toward the lake; the water surface is a different area. The tables compare whole lakes and list shore countries without treating national catchments as lake ownership shares.
What Did We Learn Today?
Victoria leads this area comparison, but Tanganyika leads the volume comparison. The result becomes meaningful only when the unit, natural-lake scope, whole-lake counting rule and source context remain visible. A map footprint, a volume estimate and a country list each describe a different aspect of the same water body.
Sources & Data Notes
Numerical comparison: HydroLAKES v1 records 16, 17 and 18. Data credit: Messager and colleagues (2016), HydroLAKES, CC BY 4.0; selected, converted and reordered for this comparison. Country context is independently sourced. Rankings are based on the reference values, not a live water-level feed.
- HydroLAKES v1: dataset, citation and CC BY 4.0 license
- HydroLAKES v1 technical documentation, December 2016
- USGS: freshwater and the water cycle
- Lake Victoria Fisheries Organization: shore countries
- FAO: Lake Tanganyika general features
- FAO 2022: Lake Malawi/Niassa/Nyasa basin assessment
- UNESCO: Lake Turkana National Parks
- NASA: Lake Chad’s Water, Wetlands, and Dunes, June 2025
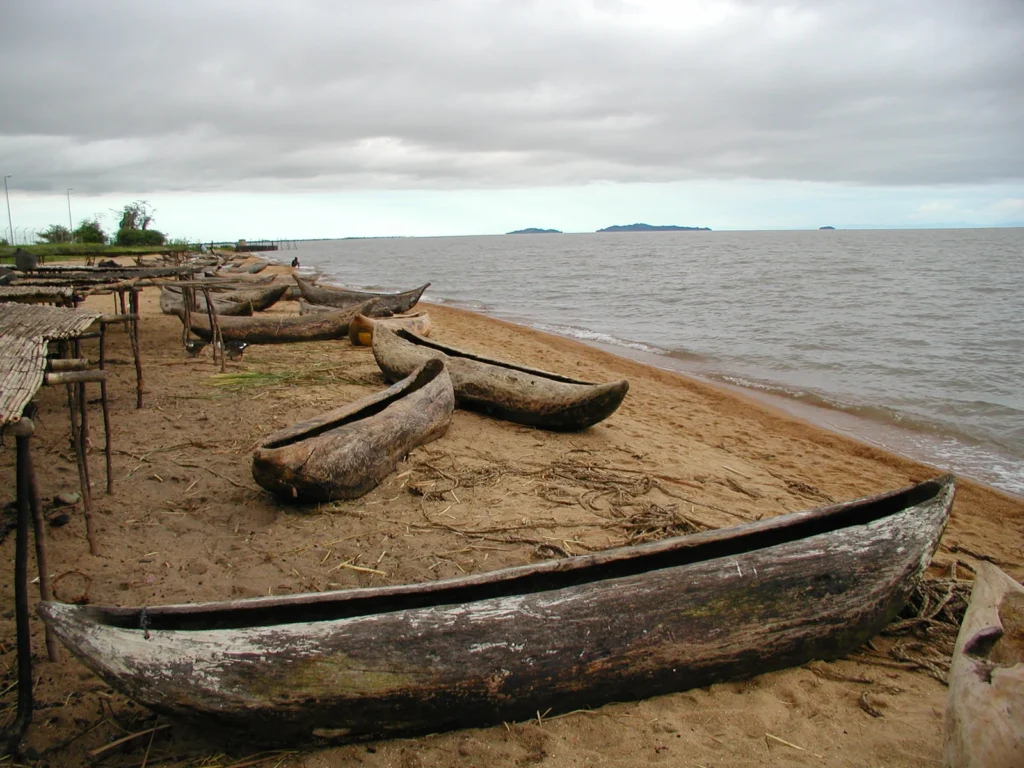
Photograph: Canoes on the shore of Lake Malawi National Park, Malawi. Photo: Lazare Eloundou Assomo / © UNESCO, CC BY-SA 3.0 IGO, via Wikimedia Commons. Resized and converted to WebP.