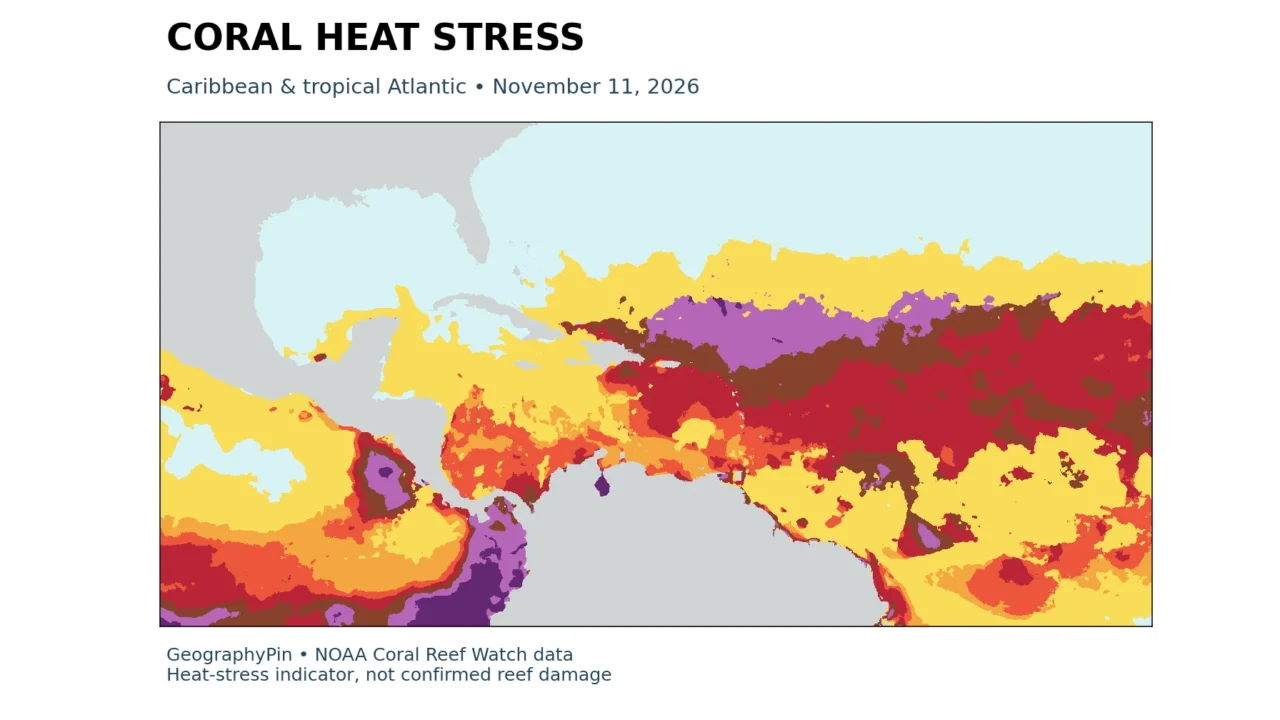
A coral bleaching risk map needs two things beside its colors: an observation date and a clear explanation of what is being measured. Ocean heat stress, the exposure of reef-containing grid cells, and damage observed by divers are related, but they are not interchangeable.
On November 11, 2026, the Atlantic had the largest share of reef-containing grid cells at bleaching-level heat stress among NOAA’s three tropical ocean basins: 19.68%. The global share was 3.06%. These are dated satellite heat-stress indicators, not measurements of how much coral had bleached or died.
How to use this article: Compare the basin results, read the alert categories, and check the measurement method before interpreting a reef’s condition.
1. Read the dated coral heat-stress map
This edition uses NOAA Coral Reef Watch’s single-day Bleaching Alert Area product, version 3.1, for November 11, 2026. The comparison date is October 11, 2026. It is a fixed snapshot, not a live map or a forecast. New observations can change the pattern substantially.
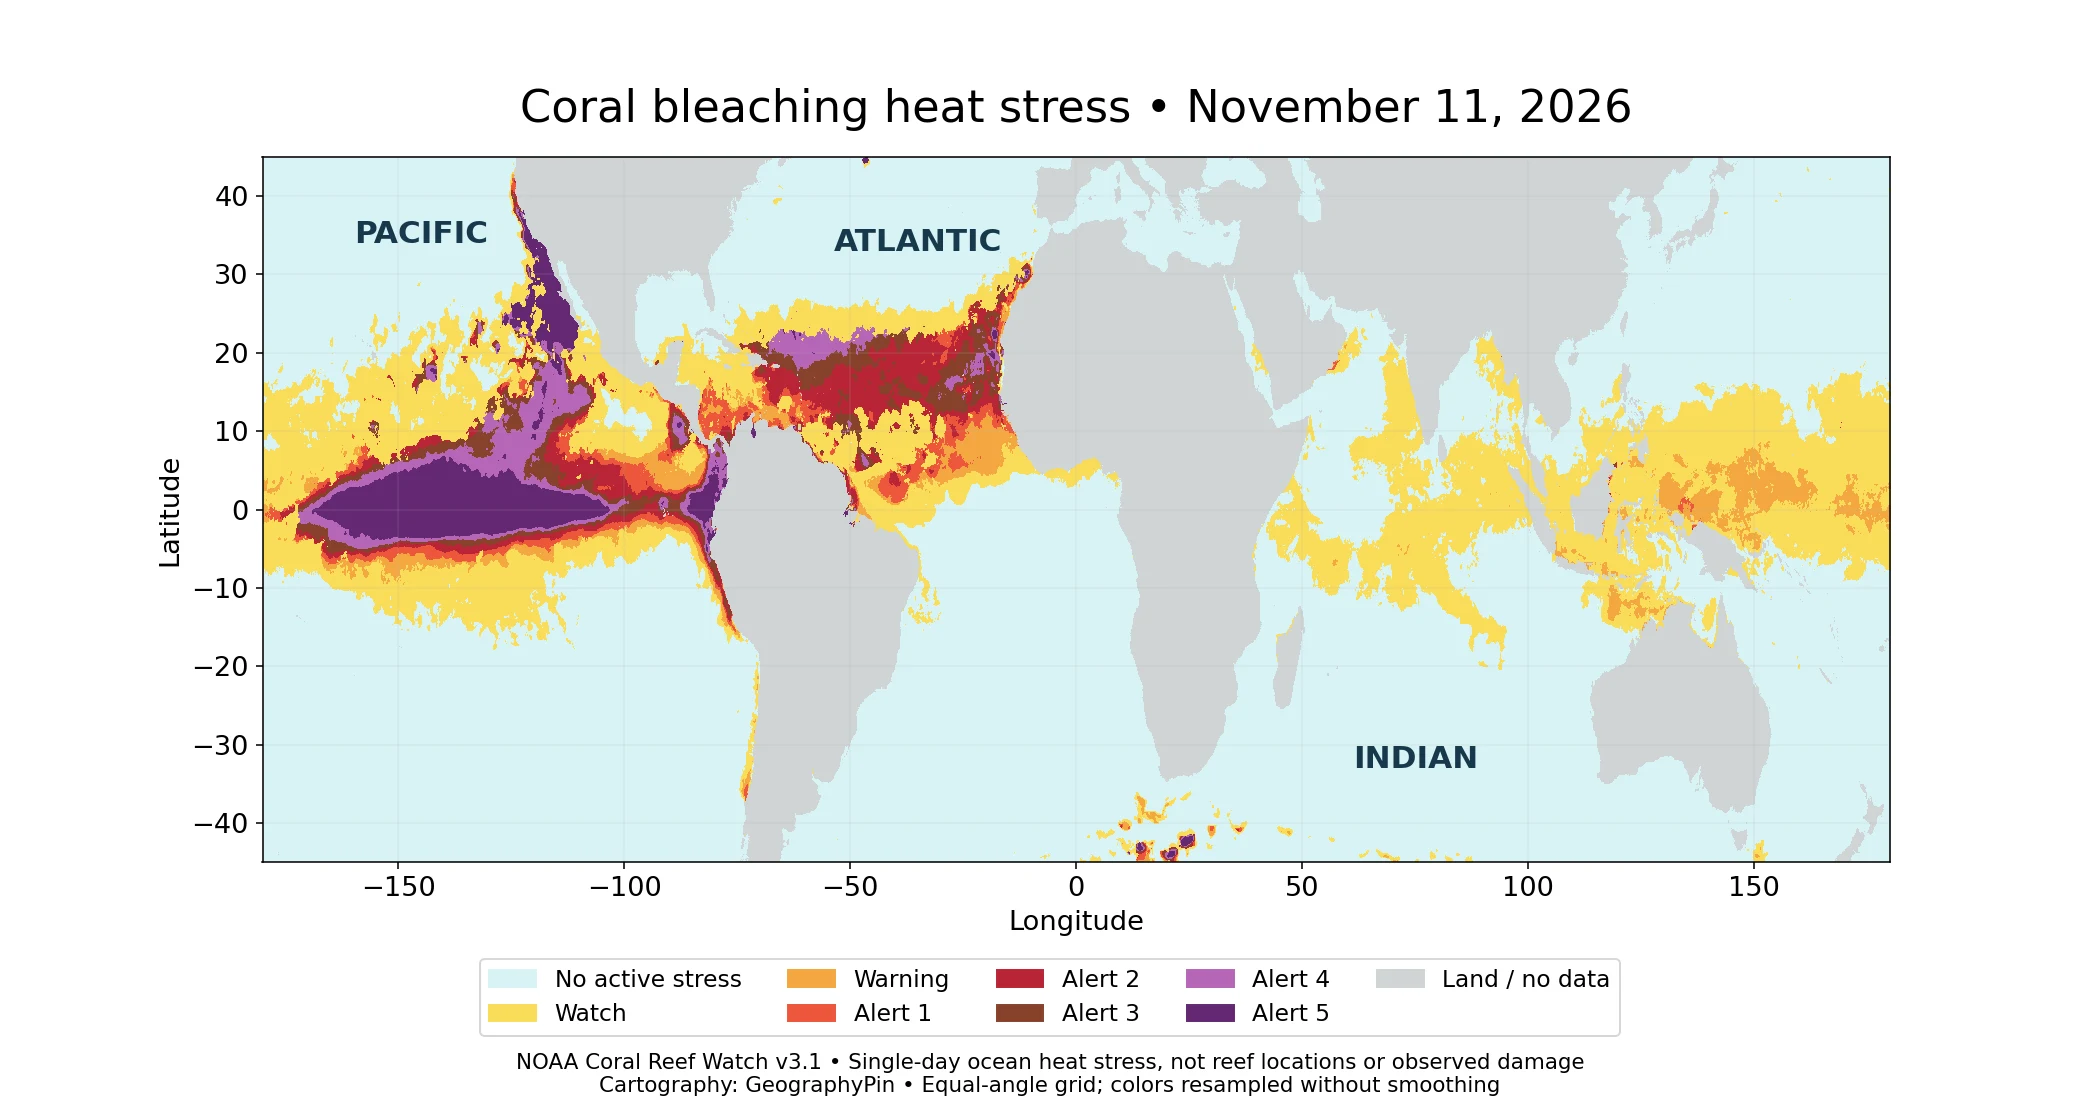
Map key: pale blue = no active stress; yellow = Watch; orange = Warning; red = Alert 1; dark red = Alert 2; brown = Alert 3; light purple = Alert 4; dark purple = Alert 5. Gray = land or unavailable data. The category thresholds are explained below.
The strongest colors describe the intensity of heat stress in individual ocean cells. They do not locate all coral reefs. In particular, a large colored patch in the open Pacific does not mean that an equally large area of coral is bleaching. To ask how much of a basin’s reef network is exposed, use the reef-grid statistics below rather than the apparent colored area.
The distinction is geographical as well as biological. Reefs occupy particular coastal and island settings, while this temperature-based product covers a much wider ocean surface. Our world ocean map provides the broader basin orientation; this page focuses on heat exposure within those basins.
2. What changed since October?
The Atlantic remained highest, but its exposed share fell
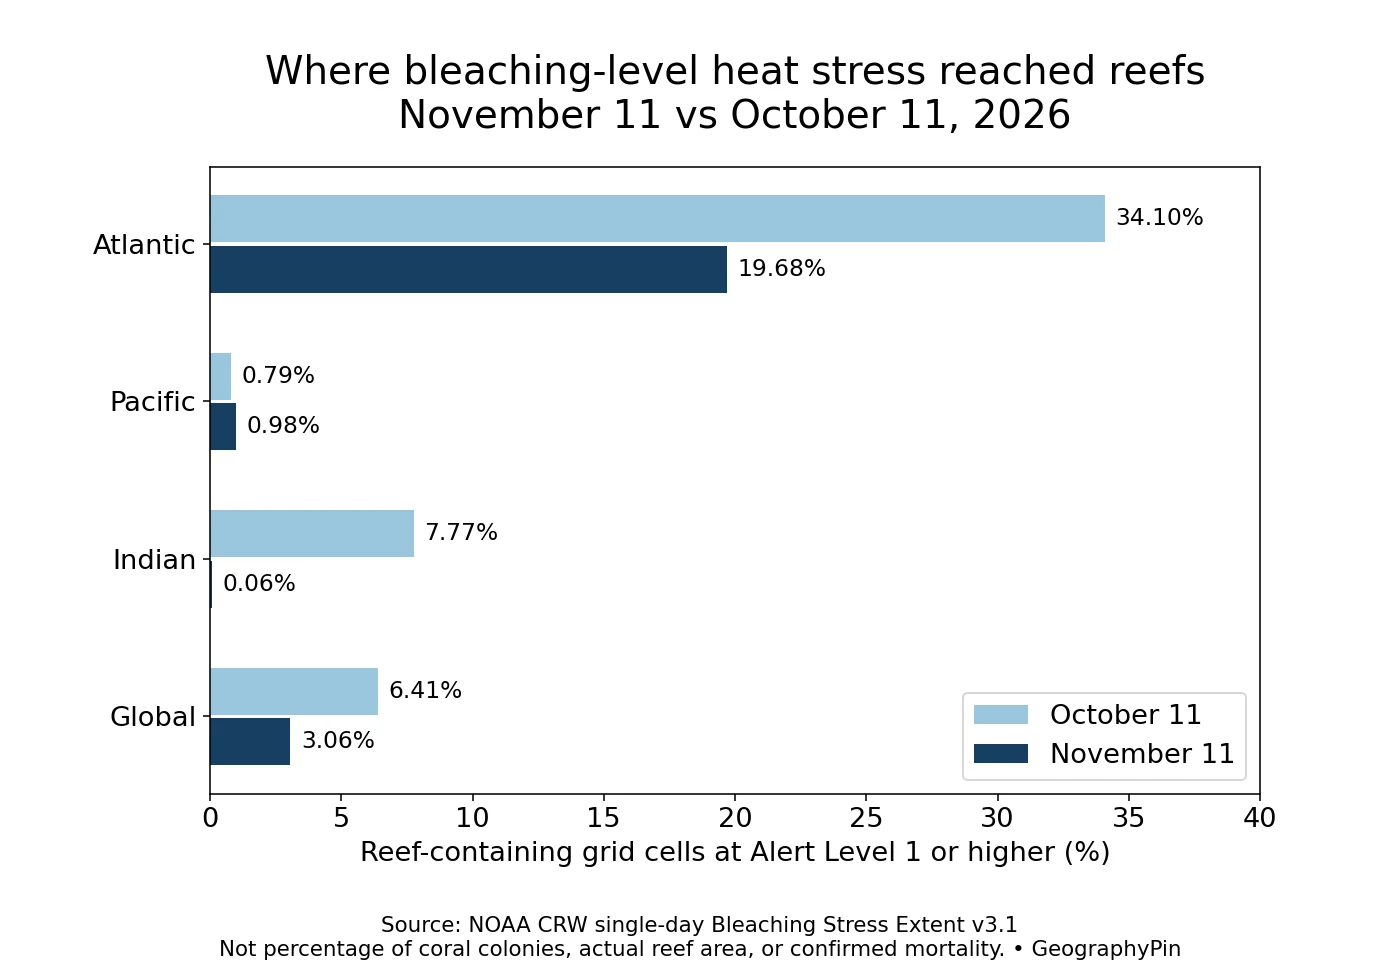
NOAA’s single-day Bleaching Stress Extent series counts reef-containing grid cells at Alert Level 1 or higher. The Atlantic percentage fell from 34.10% to 19.68% between the two dates. The Indian Ocean fell from 7.77% to 0.06%, while the Pacific rose slightly, from 0.79% to 0.98%.
| Region | October 11 | November 11 | Change |
|---|---|---|---|
| Atlantic | 34.10% | 19.68% | -14.42 pp |
| Pacific | 0.79% | 0.98% | 0.18 pp |
| Indian | 7.77% | 0.06% | -7.71 pp |
| Global | 6.41% | 3.06% | -3.35 pp |
The global share declined from 6.41% to 3.06%, a decrease of 3.35 percentage points. In the source counts, that is 3,500 versus 1,673 reef-containing grid cells. It does not mean that 1,827 reefs recovered: a cell is not a reef, and falling thermal exposure is not a biological recovery assessment.
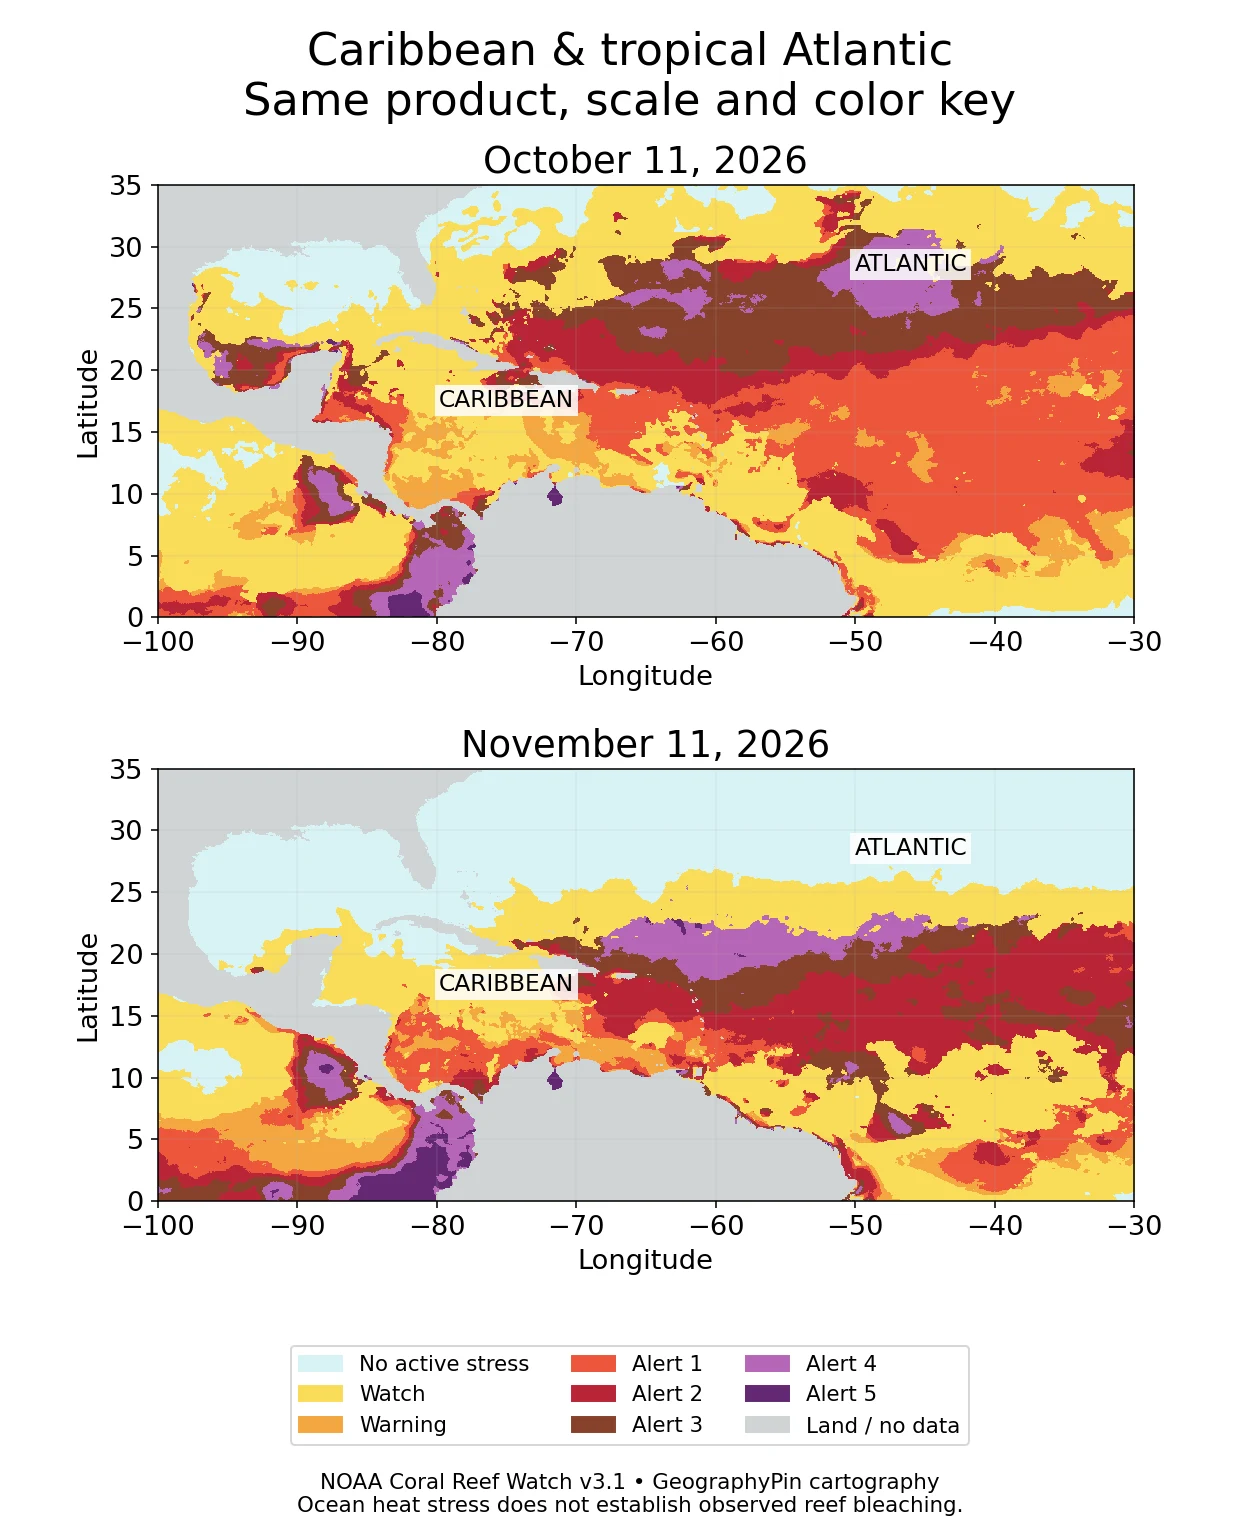
The close-up shows why a basin statistic and a local map answer different questions. A reduction across the Atlantic reef network can coexist with high alert categories in particular waters. Conversely, an offshore high-alert band can remain visually extensive without covering most reef-containing cells. Neither result justifies saying that every reef in the Caribbean improved or that every tropical Atlantic location remains at the same risk.
These are two daily snapshots one month apart, not October and November monthly averages. A day between them may have had a higher or lower value. The comparison also does not isolate the cause of the change: it should not be attributed to a particular storm, current, or climate pattern without additional evidence.
3. What the alert colors mean
A combination of present heat and accumulated exposure
NOAA’s categories combine a HotSpot, a measure of temperature above the local warm-season reference, with Degree Heating Weeks (DHW), an accumulated heat-exposure index over the preceding 12 weeks. DHW uses °C-weeks as the scientific unit; it is not simply the number of warm weeks.
For the alert levels below, the current HotSpot must be at least 1°C (1.8°F). The DHW bands distinguish the severity of accumulated exposure. A high DHW alone does not automatically place a cell in an alert category when active heat stress has subsided.
| Category | Threshold or meaning |
|---|---|
| No Stress | HotSpot at or below zero; not a declaration of healthy coral |
| Watch | HotSpot above zero but below 1°C |
| Warning | HotSpot at least 1°C and DHW above zero but below 4°C-weeks |
| Alert Level 1 | 4 to less than 8°C-weeks |
| Alert Level 2 | 8 to less than 12°C-weeks |
| Alert Level 3 | 12 to less than 16°C-weeks |
| Alert Level 4 | 16 to less than 20°C-weeks |
| Alert Level 5 | At least 20°C-weeks |
NOAA associates Alert Level 1 with risk of widespread reef bleaching. Higher categories indicate progressively greater potential for mortality, including effects on more coral species. They are risk categories, not field-confirmed mortality percentages for each mapped cell. The expanded Levels 3–5 were introduced in December 2023, so an older legend containing only Levels 1 and 2 is incomplete for these maps.
4. Heat stress is not a census of damaged reefs
Bleaching occurs when stressed corals lose the symbiotic algae that normally help feed them and give them color. NOAA’s National Ocean Service emphasizes that a bleached coral is not necessarily dead. Recovery is possible, while prolonged or severe stress can lead to mortality.
Three different statements therefore need three different kinds of evidence:
- Heat exposure: the satellite product indicates thermal conditions associated with bleaching risk.
- Observed bleaching: field observations establish whether corals actually lost their color at a particular location.
- Mortality: biological surveys determine whether corals died and how much of the community was affected.
A pale-blue cell on this edition’s map does not erase damage from an earlier event. It means that the specified single-day product did not classify active heat stress there on that date. Likewise, a falling basin percentage does not measure coral cover, biodiversity, or restoration success.
Do not compare the daily percentage here directly with a headline describing the cumulative reach of a multi-year bleaching event. A cumulative measure can count places exposed at different times. This page asks which reef-containing cells were above one threshold on each of two individual days. A short-lived reduction in that footprint and a large historical cumulative footprint can both be true.
5. How this comparison was made
Same product, dates, threshold and denominator
The maps use NOAA’s archived daily v3.1 NetCDF files for October 11 and November 11, 2026. Each cell is 0.05° in latitude and longitude, approximately 3 miles (5 kilometers) across near the equator. Cells are not equal in physical area everywhere. Our equal-angle rendering preserves the categorical values without interpolation between alert classes.
The table uses NOAA’s separate Bleaching Stress Extent series, released in September 2026. Its denominator is reef-containing grid cells in each basin or globally, not the area of living coral. We use NOAA’s supplied basin assignments and do not create a new reef mask or estimate percentages from colored map pixels.
The source download labels its last columns with percent signs but encodes proportions as decimals. We multiply those values by 100 for the percentages shown here and cross-check the scale against NOAA’s accompanying percentage chart. Changes are November minus October, calculated from the unrounded values; the article displays two decimal places.
Both selected dates have a consistent row in the downloaded series. Identical duplicate rows elsewhere in the file are not counted twice. This analysis does not average across dates or recompute a historical trend. The underlying NOAA series remains the primary source.
This edition remains labeled with its observation dates until it is replaced by a verified monthly comparison. For newer conditions, consult the NOAA single-day map. Do not use this geographic overview as a site-specific diving, conservation-intervention, or safety forecast.
Frequently Asked Questions
Does the global percentage equal the average of the three basins?
No. The basins contain different numbers of reef-containing grid cells. Averaging their percentages equally would give each basin the same weight and would not reproduce NOAA’s global result.
Why can a daily alert fall sharply?
The category depends on both active heat and accumulated exposure. If the current HotSpot drops below the alert threshold, the daily classification can fall even though substantial heat was experienced recently. That is not proof that coral has recovered.
Can a reef bleach without an extreme warm-water alert?
Yes. Heat is the focus of this product, but other stresses can cause bleaching. A satellite heat-stress map is not a complete inventory of local water-quality, light, or biological conditions.
What Did We Learn Today?
A useful coral bleaching risk map separates ocean heat intensity from the exposure of reef-containing cells and from damage observed underwater. The November comparison shows a smaller global daily exposure footprint than October, with the Atlantic still highest among the three basins. Matching dates, products and denominators makes that comparison meaningful without turning it into a claim about recovery or mortality.
Sources & Data Notes
Observation dates: October 11 and November 11, 2026. NOAA Coral Reef Watch v3.1 daily single-day categories and reef-grid Bleaching Stress Extent were used consistently. Maps and calculations are GeographyPin’s own renderings of NOAA data, not NOAA endorsements. Percentages describe grid-cell shares, not actual coral area. Gray map cells include land and unavailable observations.
- NOAA Coral Reef Watch: Single-Day Bleaching Stress Extent, Alert Level 1 or higher
- NOAA Coral Reef Watch: single-day Bleaching Alert Area and category definitions
- NOAA CRW daily products and data archive
- NOAA CRW methodology
- NOAA National Ocean Service: What is coral bleaching?
- NOAA CRW global bleaching status and cumulative-event context