Climate change is a long-term shift in Earth’s climate system, not just a run of hot days or a bad season. The modern change matters because it is now visible across temperature, oceans, ice, rainfall patterns, and sea level, and the dominant driver is human greenhouse-gas pollution. (IPCC, 2023; WMO, 2025).
Climate change is the long-term warming of Earth and the related shifts in rainfall, extremes, ice, and sea level caused mainly by human greenhouse-gas emissions. It is not the weather on one day; it is a persistent change in the whole climate system that is now measurable across the atmosphere, ocean, and land. (IPCC, 2023).
How to use this article: If you want the fastest path through it, jump straight to the greenhouse effect, the key indicators table, the clearest measured signs, or why 1.5°C and 2°C are treated differently.
How the Climate System Warms
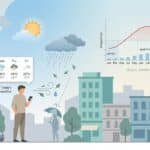
The Sun heats Earth, and greenhouse gases help hold part of that heat in the lower atmosphere. Without that natural greenhouse effect, the planet would be far colder. The problem is the extra buildup of gases such as carbon dioxide, methane, and nitrous oxide from burning fossil fuels, deforestation, cement production, agriculture, and other human activity. That added buildup strengthens the heat-trapping effect and shifts the climate system over time. (IPCC, 2023).
The greenhouse effect, and why the human signal matters
Carbon dioxide is the main long-lived driver because a meaningful share of it remains in the climate system for centuries. Methane is shorter-lived, roughly around a decade, but traps heat strongly in the near term. Nitrous oxide lasts much longer again. This mix is one reason scientists describe the warming signal as unequivocal: the fingerprints appear across the atmosphere, ocean, land, ice, and sea level, and they match greenhouse forcing far better than natural-only explanations. (IPCC, 2023).
A few indicators that matter most
For a broad article like this, the most useful numbers are the ones that show the system from different angles at once: air temperature, atmospheric CO2, sea level, ocean chemistry, and annual emissions. Together, they show that climate change is not a single statistic but a linked physical shift. (WMO, 2025; NOAA, 2025).
| Indicator | What current monitoring shows |
|---|---|
| Global average temperature | 2024 was about 1.55°C above the 1850–1900 average, the warmest year in the observational record (WMO, 2025). |
| Atmospheric CO2 benchmark | The Mauna Loa monthly average passed 430 ppm in May 2025, and NOAA still showed 429.35 ppm in February 2026 after the seasonal peak had passed (NOAA, 2026; Scripps, 2025). |
| Recent sea-level rise rate | NASA reported about 0.23 inches, or 0.59 cm, of rise in 2024 alone, above the expected recent annual pace (NASA, 2025). |
| Surface ocean acidity | Surface ocean pH has fallen by about 0.1 since the Industrial Revolution, which translates to roughly 30% more acidity (NOAA, 2025). |
| Fossil CO2 emissions | The 2024 Global Carbon Budget projected fossil CO2 emissions at about 37.4 billion tonnes, another record high (Global Carbon Budget, 2024). |
The Evidence You Can Measure
Climate change is measured through independent systems, not one dataset. Surface thermometers, satellites, weather stations, ocean buoys, tide gauges, glacier observations, and chemical monitoring all point in the same direction: the planet has warmed, the ocean has absorbed enormous amounts of excess heat, ice has declined, and sea level has risen. That agreement across methods is one reason the scientific conclusion is so strong. (IPCC, 2023; WMO, 2025).
The clearest measured signs
Air and ocean heat: 2024 overtook 2023 as the warmest year on record, and WMO reported that the decade from 2015 to 2024 contains the ten warmest years in the modern record. Sea level: global mean sea level keeps rising because warmer seawater expands and land ice adds water. Ocean chemistry: absorbed CO2 is making surface waters more acidic. Each of those signals is physically consistent with greenhouse warming, not just short-term weather variability. (WMO, 2025; NASA, 2025; NOAA, 2025).
That does not mean every place warms or dries at the same rate. Climate change shifts the long-term averages and the odds of extremes, while regional outcomes still depend on geography, circulation patterns, land use, and natural variability. That is why one location can have an unusually cold week even while the global climate trend remains upward. (IPCC, 2023).
What Causes Climate Change?
The biggest modern driver is still the energy system: coal, oil, and gas burned for electricity, heating, transport, industry, and buildings. UNEP and the IPCC both treat fossil-fuel use as the core source of the problem, and broad global breakdowns usually place roughly three-quarters of greenhouse-gas emissions in energy-related activity once electricity, fuel use, industry, and buildings are counted together. (IPCC, 2023; UNEP, 2024).
Agriculture, land-use change, and food systems matter too. FAO estimated agrifood-system emissions at 16.2 billion tonnes of CO2 equivalent in 2022, or just under 30% of the global total. That is why climate policy is not only about power plants and cars. It also touches forests, livestock methane, fertilizer use, rice cultivation, food waste, and supply chains. (FAO, 2024).
Impacts You Can Feel
Climate change raises the baseline on which everyday weather plays out. Hot spells become more likely and more intense, heavy rainfall events can dump more water into a short window, drought risk grows in some regions, wildfire seasons can lengthen, and coastal floods start from a higher sea level than before. None of that means every event is caused only by climate change, but it does mean the odds are being shifted. (IPCC, 2023).
The effects are not only environmental. Heat stresses health systems and workers, water stress can hit agriculture and cities, marine warming and acidification affect fisheries and reefs, and rising seas increase the cost of protecting ports, roads, homes, and freshwater systems near the coast. The burden is often heaviest where infrastructure, income, or adaptive capacity is weaker. (IPCC, 2023; WMO, 2025).
What the Future Looks Like
Why 1.5°C and 2°C are treated differently
The difference between 1.5°C and 2°C is not symbolic. It is a difference in risk. The IPCC has long shown that extra warming increases the chance of harsher heat, stronger heavy-rain extremes, ecosystem losses, and adaptation limits in more places. UNEP’s 2024 Emissions Gap assessment estimated that current policies are more consistent with roughly 3.1°C of warming this century, while full implementation of today’s unconditional and conditional pledges would still leave the world around 2.8°C and 2.6°C respectively. (IPCC, 2023; UNEP, 2024).
Another important point is timing. Temperature can respond comparatively quickly to emissions cuts, but sea level is slower because oceans store heat and ice sheets react over longer periods. So even a stronger mitigation path does not stop all change right away. It lowers the peak risk, slows future damage, and gives adaptation a better chance to work. (IPCC, 2023; NASA, 2025).
What We Can Do
Mitigation means cutting the causes of warming: cleaner electricity, electrified transport and heating, more efficient buildings and industry, lower methane losses, lower-carbon materials, and better protection of forests and other carbon-rich ecosystems. The common thread is simple: less greenhouse gas released to the atmosphere. (IPCC, 2023; UNEP, 2024).
Adaptation means reducing harm from the warming already underway: heat-ready cities, water planning, drought-resistant farming, flood-aware construction, coastal protection, early-warning systems, and stronger public-health response. Mitigation and adaptation are not substitutes. The safer path is doing both at the same time, because every fraction of a degree avoided reduces future pressure on people, economies, and ecosystems. (IPCC, 2023).
FAQ
Is climate change the same thing as weather?
No. Weather is short-term atmospheric conditions such as today’s temperature, wind, or rain. Climate is the long-term pattern, usually discussed over decades. Climate change means those long-term patterns are shifting, even though day-to-day weather still rises and falls. (IPCC, 2023).
Is today’s climate change mainly caused by humans?
Yes. The IPCC’s assessment language is direct: it is unequivocal that human influence has warmed the atmosphere, ocean, and land. Natural factors still affect year-to-year variability, but they do not explain the modern warming trend on their own. (IPCC, 2023).
How much has Earth already warmed?
For the full year 2024, WMO reported a global average temperature about 1.55°C above the 1850–1900 baseline. That does not mean the Paris 1.5°C limit has been formally breached on a long-term basis, but it does show how close the world now is to that threshold. (WMO, 2025).
Why does CO2 get so much attention if methane is stronger?
Methane is very powerful in the short term, but CO2 matters so much because far larger quantities are emitted and a meaningful share remains in the climate system for a very long time. In practice, both matter: methane cuts can help sooner, while CO2 cuts are essential for long-term stabilization. (IPCC, 2023).
Can climate change still be limited?
Yes, but not by delay. The remaining level of future warming still depends heavily on how fast emissions fall. That is why climate policy keeps focusing on this decade: earlier cuts reduce peak warming and lower later adaptation pressure. (UNEP, 2024; IPCC, 2023).
Why do climate figures sometimes vary slightly between sources?
The main reason is method, not contradiction. Different institutions may use different reference periods, slightly different datasets, or different reporting windows. That can change the exact number a little, while the overall direction and the physical conclusion remain the same. (WMO, 2025).
What Did We Learn Today?
Climate change is the long-term warming and reworking of Earth’s climate system, driven mainly by human greenhouse-gas emissions. The strongest proof is not one number but a whole pattern: hotter years, higher CO2, warmer oceans, rising seas, and mounting risks that get harder to manage the longer deep emissions cuts are delayed.
Sources & Data Notes
For a topic like this, I lean on synthesis-heavy sources first: IPCC assessment reports, WMO climate summaries, NOAA and NASA monitoring pages, UNEP scenario work, and statistical releases such as FAO and the Global Carbon Budget. I keep the framing broad unless a figure is well established, some values are rounded for readability, and newer releases can shift individual numbers a bit without changing the overall picture. GeographyPin visuals or formatting support may sometimes be AI-assisted, but I still try to keep the factual spine anchored in mainstream institutional sources.