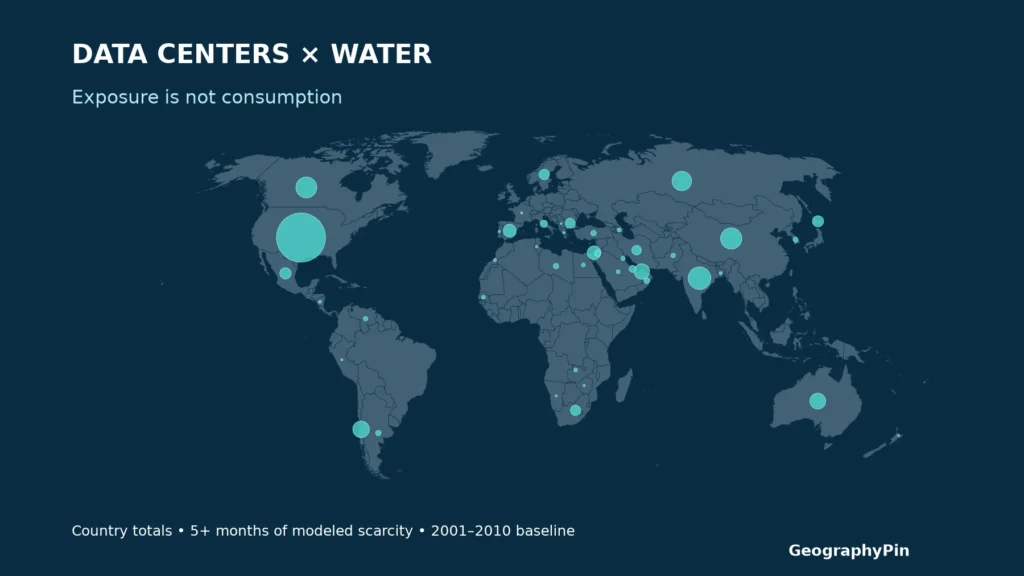
A country with many data centers can lead an exposure ranking without having the largest exposed percentage. That distinction matters when comparing digital infrastructure with local water availability: the number of facilities, the share of a sample, and the water those facilities consume are different measurements.
The United States has the largest count of covered data centers exposed to five or more months of modeled water scarcity, while several smaller samples have much higher percentages. These maps compare a published facility inventory against a 2001–2010 hydrological baseline. They do not measure present-day water use, outages, or scarcity caused by data centers.
How to use this article: Compare the largest exposed counts, check small-sample percentages, or inspect the source-label exception before reusing the data.
1. What the two maps show
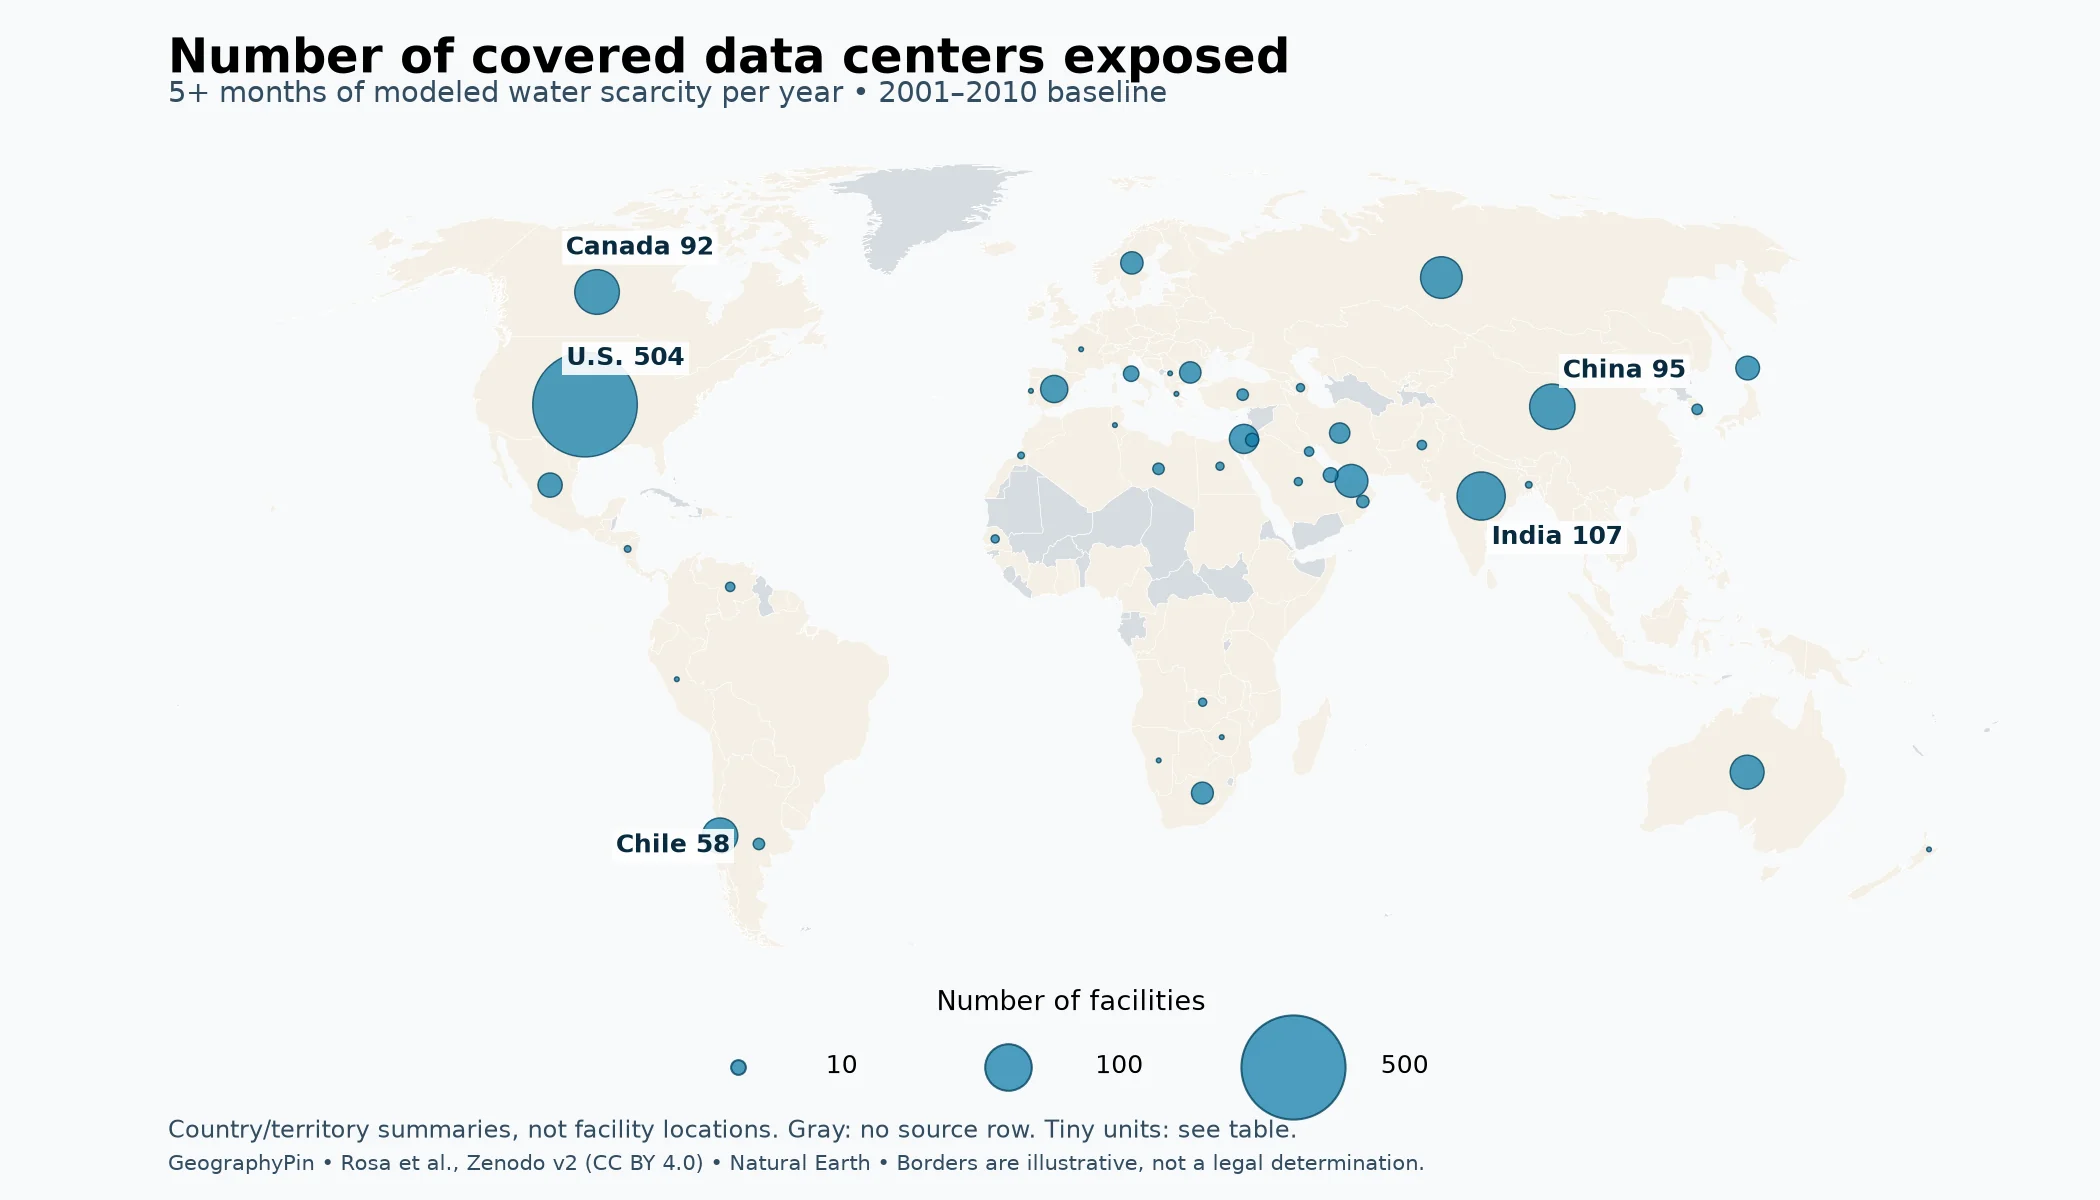
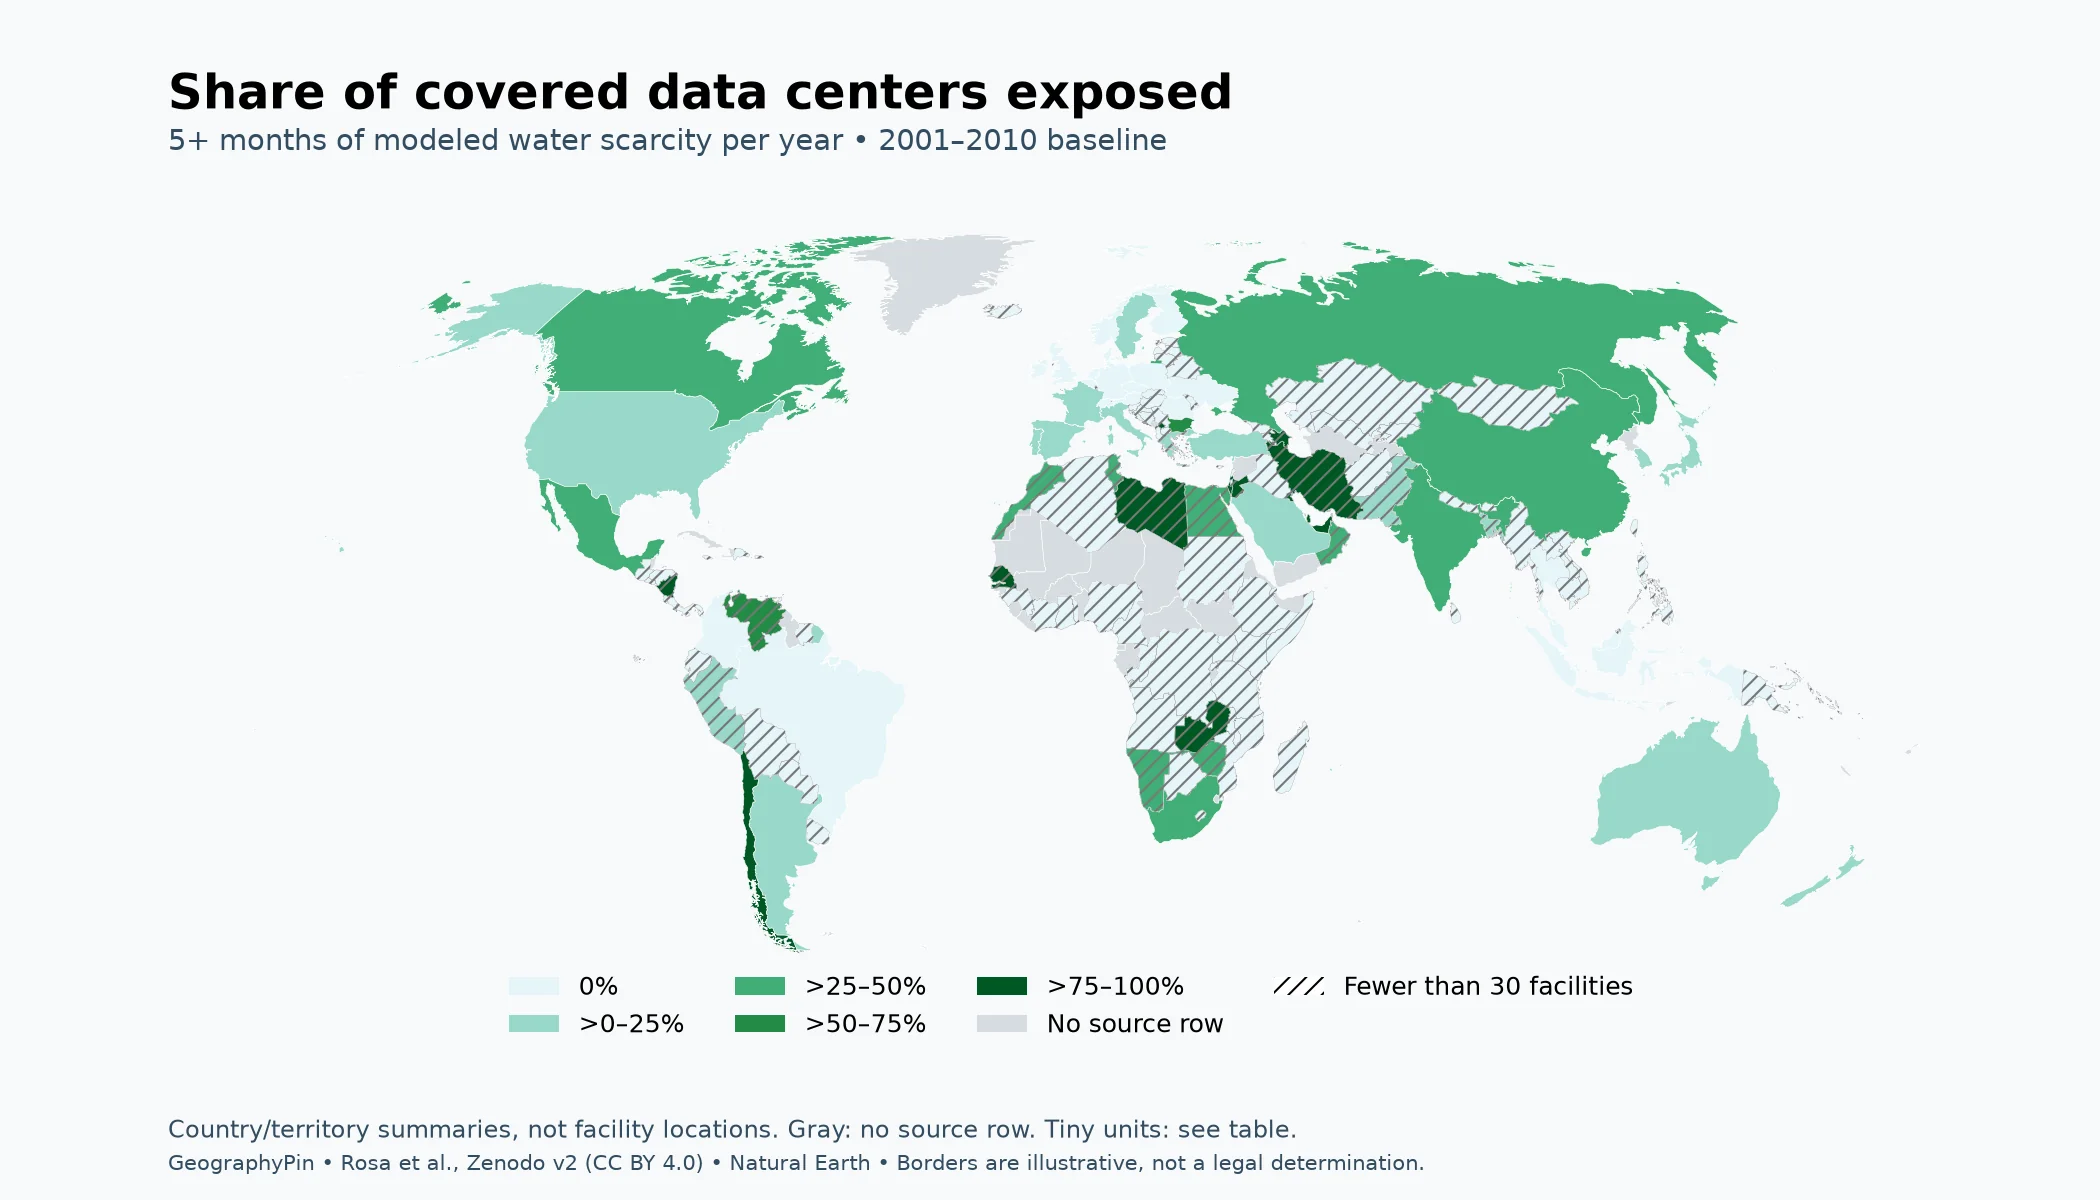
The maps use five or more months of water scarcity per year as a clearly defined comparison threshold. GeographyPin calculated it by adding the published 5–8-month and 9–12-month categories in Rosa and colleagues’ September 2026 country workbook. The underlying hydrological baseline is 2001–2010, not a map of conditions observed in 2026.
Here, scarcity means a modeled monthly water gap: consumption exceeds available renewable water after allowance for environmental flows. The research overlays facility locations on that water balance; it does not add measured facility cooling demand to calculate the gap.


Country boundaries provide orientation only. Coloring an entire country does not mean that every part of it experiences the same conditions. Hong Kong, Macau, Puerto Rico and other separately reported territories remain separate reporting units. The source’s classification is retained for comparison, without implying a position on sovereignty.
The full table below is the better reference for small places and exact denominators. Gibraltar is present in the data but absent from this map’s Natural Earth geometry. One additional source row, labeled “Vladivostok,” is not treated as a country or silently reassigned.
2. Count versus share: two different rankings
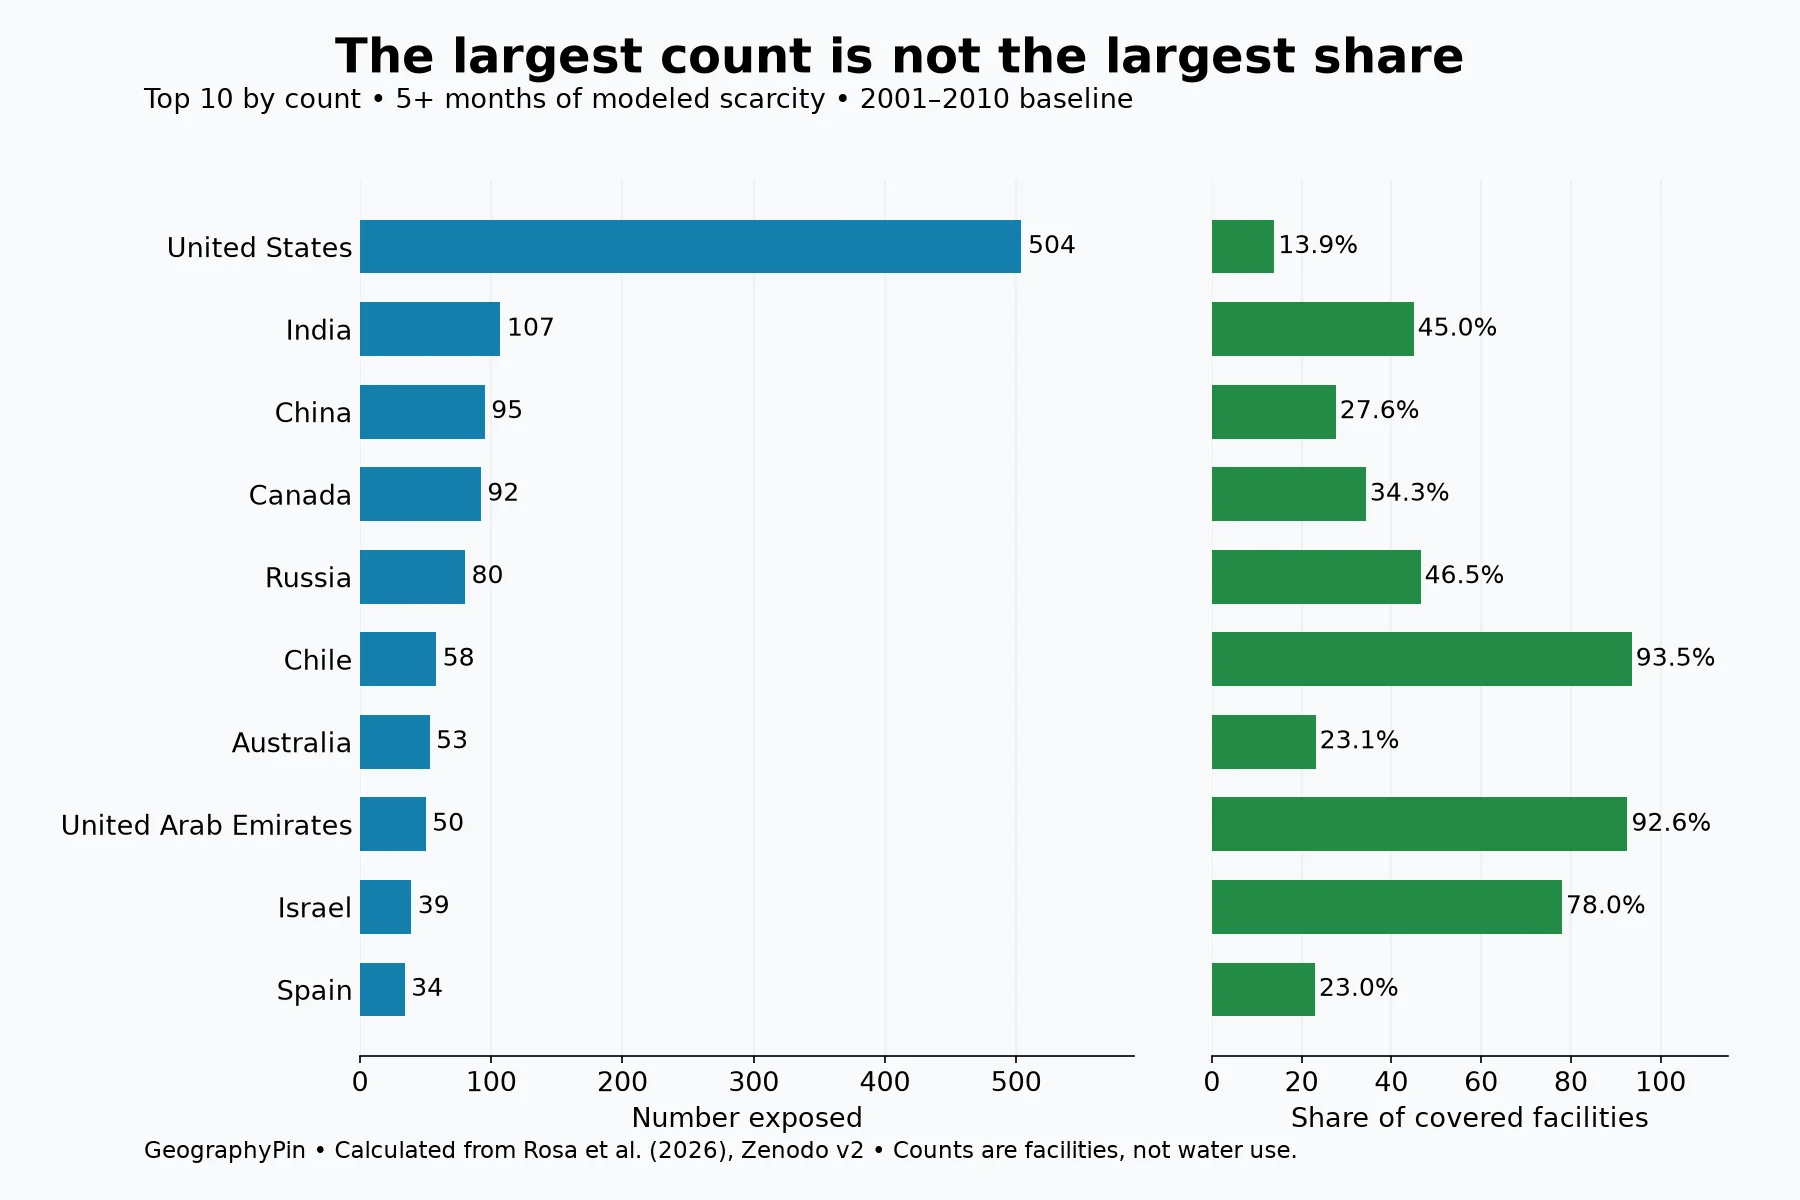
The largest counts in the covered inventory
The United States leads this comparison with 504 covered facilities in the five-plus-month categories. Its share is 13.9% because the workbook includes 3,619 U.S. facilities. India follows by count with 107 of 238, or 45.0%; China has 95 of 344, or 27.6%.
Chile illustrates why both measures are useful. Its 58 exposed facilities are fewer than the U.S. count, but they represent 93.5% of its 62 covered facilities. A percentage answers how concentrated exposure is within the covered sample. A count answers how many sampled facilities fall into the category. Neither answers which country uses the most cooling water.
High percentages need a sample-size check
A 100% result can mean 10 out of 10 facilities, as in Qatar, or one out of one, as in the source’s Kosovo row. Those are valid fractions of their covered samples, but they do not carry the same amount of information. They also cannot establish that every operating facility in either place was included.
For that reason, the table always shows the denominator and marks samples below 30. The threshold is a practical reading aid, not a claim that 30 facilities make a sample representative. The underlying inventory is not a random survey, so a conventional polling margin of error would be misleading.
Across all 9,347 covered facilities, 1,354 fall in the five-plus-month categories: 14.5%, rounded to one decimal place. That is a different threshold from the study’s widely reported “one quarter” finding, which includes exposure for at least one month. The two numbers answer different questions.
Open the complete country and territory comparison
Sorted by exposed count, then covered count. An asterisk marks fewer than 30 facilities. Percentages are rounded; original source labels are preserved. The “Vladivostok” row is an unassigned source label, not a country.
| Source reporting unit | Covered | Exposed | Share |
|---|---|---|---|
| USA | 3,619 | 504 | 13.9% |
| India | 238 | 107 | 45.0% |
| China | 344 | 95 | 27.6% |
| Canada | 268 | 92 | 34.3% |
| Russia | 172 | 80 | 46.5% |
| Chile | 62 | 58 | 93.5% |
| Australia | 229 | 53 | 23.1% |
| United Arab Emirates | 54 | 50 | 92.6% |
| Israel | 50 | 39 | 78.0% |
| Spain | 148 | 34 | 23.0% |
| Mexico | 57 | 27 | 47.4% |
| Japan | 149 | 26 | 17.4% |
| Sweden | 96 | 23 | 24.0% |
| South Africa | 49 | 22 | 44.9% |
| Bulgaria | 30 | 21 | 70.0% |
| Iran* | 20 | 19 | 95.0% |
| Italy | 175 | 11 | 6.3% |
| Qatar* | 10 | 10 | 100.0% |
| Jordan* | 8 | 8 | 100.0% |
| Oman* | 15 | 7 | 46.7% |
| Turkey | 79 | 6 | 7.6% |
| Argentina | 33 | 6 | 18.2% |
| Libya* | 6 | 6 | 100.0% |
| South Korea | 77 | 5 | 6.5% |
| Pakistan* | 22 | 4 | 18.2% |
| Venezuela* | 6 | 4 | 66.7% |
| Kuwait* | 4 | 4 | 100.0% |
| Saudi Arabia | 34 | 3 | 8.8% |
| Egypt* | 11 | 3 | 27.3% |
| Gibraltar* | 3 | 3 | 100.0% |
| Azerbaijan* | 3 | 3 | 100.0% |
| Senegal* | 3 | 3 | 100.0% |
| Zambia* | 3 | 3 | 100.0% |
| Bangladesh* | 13 | 2 | 15.4% |
| Morocco* | 6 | 2 | 33.3% |
| Nicaragua* | 2 | 2 | 100.0% |
| France | 255 | 1 | 0.4% |
| New Zealand | 54 | 1 | 1.9% |
| Portugal | 38 | 1 | 2.6% |
| Greece* | 19 | 1 | 5.3% |
| Peru* | 14 | 1 | 7.1% |
| Tunisia* | 3 | 1 | 33.3% |
| Zimbabwe* | 2 | 1 | 50.0% |
| Namibia* | 2 | 1 | 50.0% |
| Kosovo* | 1 | 1 | 100.0% |
| United Kingdom | 420 | 0 | 0.0% |
| Germany | 410 | 0 | 0.0% |
| The Netherlands | 189 | 0 | 0.0% |
| Brazil | 170 | 0 | 0.0% |
| Indonesia | 137 | 0 | 0.0% |
| Ireland | 119 | 0 | 0.0% |
| Switzerland | 110 | 0 | 0.0% |
| Hong Kong | 92 | 0 | 0.0% |
| Poland | 86 | 0 | 0.0% |
| Malaysia | 84 | 0 | 0.0% |
| Singapore | 74 | 0 | 0.0% |
| Norway | 63 | 0 | 0.0% |
| Romania | 57 | 0 | 0.0% |
| Denmark | 56 | 0 | 0.0% |
| Finland | 49 | 0 | 0.0% |
| Czech Republic | 49 | 0 | 0.0% |
| Austria | 47 | 0 | 0.0% |
| Belgium | 45 | 0 | 0.0% |
| Thailand | 38 | 0 | 0.0% |
| Ukraine | 35 | 0 | 0.0% |
| Colombia | 33 | 0 | 0.0% |
| Vietnam* | 25 | 0 | 0.0% |
| Latvia* | 24 | 0 | 0.0% |
| Philippines* | 23 | 0 | 0.0% |
| Taiwan* | 21 | 0 | 0.0% |
| Slovenia* | 21 | 0 | 0.0% |
| Nigeria* | 16 | 0 | 0.0% |
| Hungary* | 16 | 0 | 0.0% |
| Kenya* | 16 | 0 | 0.0% |
| Cyprus* | 15 | 0 | 0.0% |
| Croatia* | 15 | 0 | 0.0% |
| Lithuania* | 14 | 0 | 0.0% |
| Panama* | 14 | 0 | 0.0% |
| Slovakia* | 13 | 0 | 0.0% |
| Luxembourg* | 13 | 0 | 0.0% |
| Estonia* | 12 | 0 | 0.0% |
| Serbia* | 12 | 0 | 0.0% |
| Costa Rica* | 10 | 0 | 0.0% |
| Cambodia* | 10 | 0 | 0.0% |
| Ecuador* | 9 | 0 | 0.0% |
| Tanzania* | 9 | 0 | 0.0% |
| Uruguay* | 9 | 0 | 0.0% |
| Angola* | 8 | 0 | 0.0% |
| Puerto Rico* | 8 | 0 | 0.0% |
| Macedonia* | 7 | 0 | 0.0% |
| Iceland* | 7 | 0 | 0.0% |
| Ghana* | 7 | 0 | 0.0% |
| Nepal* | 6 | 0 | 0.0% |
| Moldova* | 6 | 0 | 0.0% |
| Bahrain* | 5 | 0 | 0.0% |
| Jersey* | 5 | 0 | 0.0% |
| Guatemala* | 5 | 0 | 0.0% |
| Algeria* | 5 | 0 | 0.0% |
| Bolivia* | 5 | 0 | 0.0% |
| Paraguay* | 4 | 0 | 0.0% |
| Isle of Man* | 4 | 0 | 0.0% |
| Myanmar* | 4 | 0 | 0.0% |
| Liechtenstein* | 4 | 0 | 0.0% |
| Ethiopia* | 4 | 0 | 0.0% |
| Kazakhstan* | 4 | 0 | 0.0% |
| Georgia* | 4 | 0 | 0.0% |
| Honduras* | 4 | 0 | 0.0% |
| Guernsey* | 3 | 0 | 0.0% |
| Botswana* | 3 | 0 | 0.0% |
| Uzbekistan* | 3 | 0 | 0.0% |
| DR Congo* | 3 | 0 | 0.0% |
| El Salvador* | 3 | 0 | 0.0% |
| Uganda* | 3 | 0 | 0.0% |
| Ivory Coast* | 3 | 0 | 0.0% |
| Albania* | 3 | 0 | 0.0% |
| Mozambique* | 3 | 0 | 0.0% |
| Bosnia and Herzegovina* | 3 | 0 | 0.0% |
| Suriname* | 2 | 0 | 0.0% |
| Trinidad and Tobago* | 2 | 0 | 0.0% |
| Sri Lanka* | 2 | 0 | 0.0% |
| Afghanistan* | 2 | 0 | 0.0% |
| Lesotho* | 2 | 0 | 0.0% |
| Kyrgyzstan* | 2 | 0 | 0.0% |
| Laos* | 2 | 0 | 0.0% |
| Belarus* | 2 | 0 | 0.0% |
| Bhutan* | 2 | 0 | 0.0% |
| Lebanon* | 2 | 0 | 0.0% |
| Monaco* | 2 | 0 | 0.0% |
| Djibouti* | 2 | 0 | 0.0% |
| Madagascar* | 2 | 0 | 0.0% |
| Dominican Republic* | 1 | 0 | 0.0% |
| Guinea* | 1 | 0 | 0.0% |
| Cameroon* | 1 | 0 | 0.0% |
| Jamaica* | 1 | 0 | 0.0% |
| Brunei* | 1 | 0 | 0.0% |
| Vladivostok* | 1 | 0 | 0.0% |
| Armenia* | 1 | 0 | 0.0% |
| Iraq* | 1 | 0 | 0.0% |
| Rwanda* | 1 | 0 | 0.0% |
| Solomon Islands* | 1 | 0 | 0.0% |
| Macau* | 1 | 0 | 0.0% |
| Malawi* | 1 | 0 | 0.0% |
| Mongolia* | 1 | 0 | 0.0% |
| Sudan* | 1 | 0 | 0.0% |
| Palestine* | 1 | 0 | 0.0% |
| Papua New Guinea* | 1 | 0 | 0.0% |
| Republic of the Congo* | 1 | 0 | 0.0% |
| Somalia* | 1 | 0 | 0.0% |
| Togo* | 1 | 0 | 0.0% |
The downloadable comparison data also include all four baseline categories, the warming-scenario categories, denominators and mapping notes, so the table can be sorted or checked in a spreadsheet.
3. Baseline and warming scenario
The workbook also reports results for a global warming level of 5.4°F (3°C) above preindustrial conditions. This is a modeled climate comparison, not a forecast that every place reaches these conditions in 2050. It keeps the covered facility inventory rather than predicting where future data centers will be built.
The baseline and warming columns must not be mixed in a single ranking. GeographyPin’s five-plus-month calculation is 1,354 facilities under the baseline and an ensemble-average equivalent of 1,528.2 under the warming scenario. Relative to the same 9,347-facility denominator, those are 14.5% and 16.3%.
| Months per year | 2001–2010 baseline | +3°C scenario average |
|---|---|---|
| 0 | 7,032 | 6,301.6 |
| 1–4 | 961 | 1,517.2 |
| 5–8 | 831 | 994.4 |
| 9–12 | 523 | 533.8 |
| All categories | 9,347 | 9,347.0 |
Fractional scenario values are not fractional buildings. They are averages across model results. Rounding each category to an integer before calculating percentages can introduce small discrepancies, so the comparison preserves the workbook values and rounds only the final displayed percentages.
A higher global total does not mean exposure increases in every reporting unit. The downloadable data retain country-specific results rather than applying a single global increase everywhere. A precise local decision would require much more information than this country summary provides.
4. Why exposure is not water consumption
Exposure is a location-based comparison with modeled water availability and demand. It is not a meter reading from a data center. The study does not provide a globally consistent facility-by-facility record of cooling technology, capacity or water sourcing, and its public workbook does not provide facility coordinates.
Consider two facilities in the same modeled scarcity category. One may rely heavily on evaporative cooling; another may use dry cooling or recycled water. Their presence in the same category does not establish that they withdraw or consume the same volume. Electricity supply can also have a water footprint elsewhere, which a country’s exposed-facility count does not quantify.
Three common readings therefore go beyond the evidence:
- “These are all AI facilities.” The inventory covers data centers generally, not an AI-only classification.
- “They caused the water shortage.” A geographic overlap does not measure each facility’s contribution to scarcity.
- “They will shut down.” Exposure does not by itself establish operational failure, restrictions or harm to other users.
The useful next questions concern the local supply system: which basin provides the water, what other users depend on it, how demand varies through the year, and which buffers or alternatives exist. The water cycle explains why water movement matters; a country-level summary cannot replace a local water balance.
The distinction between a count and a ratio also appears in population-density comparisons. Changing the denominator changes the question. Here the denominator is covered facilities, not land area, population, server capacity or gallons consumed.
5. How the country comparison was calculated
The comparison uses the “Summary by country” sheet in the authors’ Zenodo version 2, published September 23, 2026. For every source row, the four baseline categories sum to its covered count; the four warming categories also reconcile to that count. The 149 reporting rows sum to the stated global inventory of 9,347.
The calculation is straightforward: exposed count = 5–8-month count + 9–12-month count. The percentage is that sum divided by the covered count, multiplied by 100. Country shapes come from Natural Earth; circle sizes encode counts, while choropleth colors encode percentages. No proprietary facility points were reconstructed.
A source label that should not be silently fixed
The workbook lists “Vladivostok” separately from Russia, with one facility and zero baseline exposure. Vladivostok is a city, so it is not mapped as a country. The row is retained in the downloadable source-aligned table and global denominator, but it is not merged into Russia: the public workbook alone does not establish whether that would correct a label or create another error.
Russia’s displayed result therefore remains the source row’s 80 exposed out of 172 covered facilities, not a revised national inventory. Reporting this exception makes the calculation reproducible without disguising the source’s classification problem.
Gibraltar’s three facilities are also retained in the table even though this world basemap lacks a separate polygon for it. Other small territories can be difficult to distinguish at this scale. No source row is not the same as zero facilities, and zero exposure in this model is not a guarantee of water security.
The maps are a dated research comparison. They should be revised when the authors release a corrected or expanded dataset, not relabeled “live” simply because the article is republished.
Frequently Asked Questions
Can I use this map to choose a specific data-center site?
No. The country summary is a screening comparison. Site selection requires local supply, legal, environmental and operational information, and the public workbook does not disclose the underlying facility coordinates.
Does a zero-percent country have no drought risk?
No. It means none of that reporting unit’s covered facilities falls in this article’s five-plus-month baseline categories. Shorter modeled exposure, other drought effects and facilities outside the sample are different questions.
Can the original data be reused?
The Zenodo dataset is released under Creative Commons Attribution 4.0. Credit the authors, link to the dataset and license, and identify any changes. The research paper’s illustrations have a separate license; these maps are newly drawn from the country data rather than copied from the paper.
What Did We Learn Today?
Data-center water exposure can look very different when measured by count or by share of the covered sample. A useful comparison keeps its threshold, denominator and hydrological baseline visible, treats small samples cautiously, and separates modeled exposure from actual consumption or operational harm. Transparent source exceptions are part of the result, not details to hide.
Sources & Data Notes
Maps and five-plus-month calculations by GeographyPin from Rosa et al.’s September 23, 2026 Zenodo v2 country workbook, licensed CC BY 4.0. Baseline: 2001–2010. Warming columns are model averages, not a future facility inventory. Natural Earth supplies illustrative administrative geometry; labels and separate reporting units do not determine sovereignty. The Vladivostok source row and Gibraltar mapping omission are explained above. No third-party paper figure has been reproduced.
- Rosa and colleagues: country dataset, version 2, documentation and download
- Rosa et al. (2026), One Quarter of Global Data Centers are Located in Water-Stressed Areas
- Full research paper: methods, exposure interpretation and limitations
- Natural Earth: 1:50m administrative-country geometry
- Creative Commons Attribution 4.0 license