Brisbane’s river bends are its most recognizable geographic feature, but they do not tell the whole story. Hills, creek valleys and an estuarine bay create a varied setting around the city. Understanding that landscape also means separating Brisbane City Council’s territory from the much larger region commonly called Greater Brisbane.
Brisbane is in southeastern Queensland, Australia, on the lower Brisbane River upstream from Moreton Bay. Its landscape combines river bends, low-lying floodplain areas, creek valleys and hills. The city council area is only part of the wider metropolitan region. Flood exposure varies with local terrain, drainage, rainfall, river levels and coastal influences.
Start with the landscape: Follow the river and floodplain, distinguish the bay from the open coast, compare city and metropolitan boundaries, or read the different sources of flooding.
1. Where is Brisbane?
Brisbane is Queensland’s capital, on Australia’s eastern side in the South East Queensland region. It is a state capital, while Canberra is Australia’s national capital. Its central business district sits beside the Brisbane River, inland from the river’s mouth. The river continues through the urban area before entering Moreton Bay.
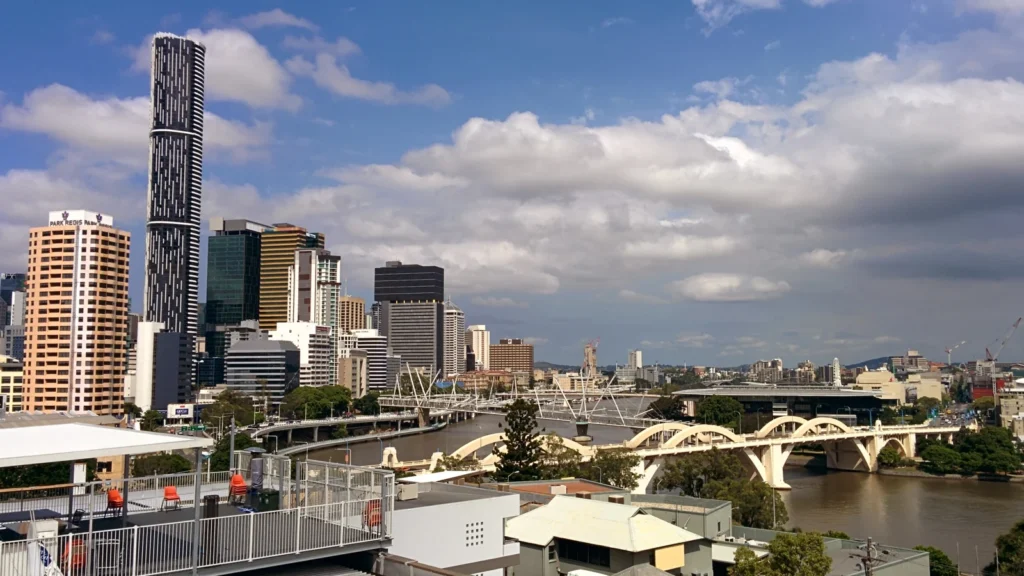
This is a coastal-region city, but the central waterfront is a riverfront rather than an open-ocean beach. That distinction explains why a photograph of the city’s bridges and skyline looks very different from the seaward beaches of the offshore islands.
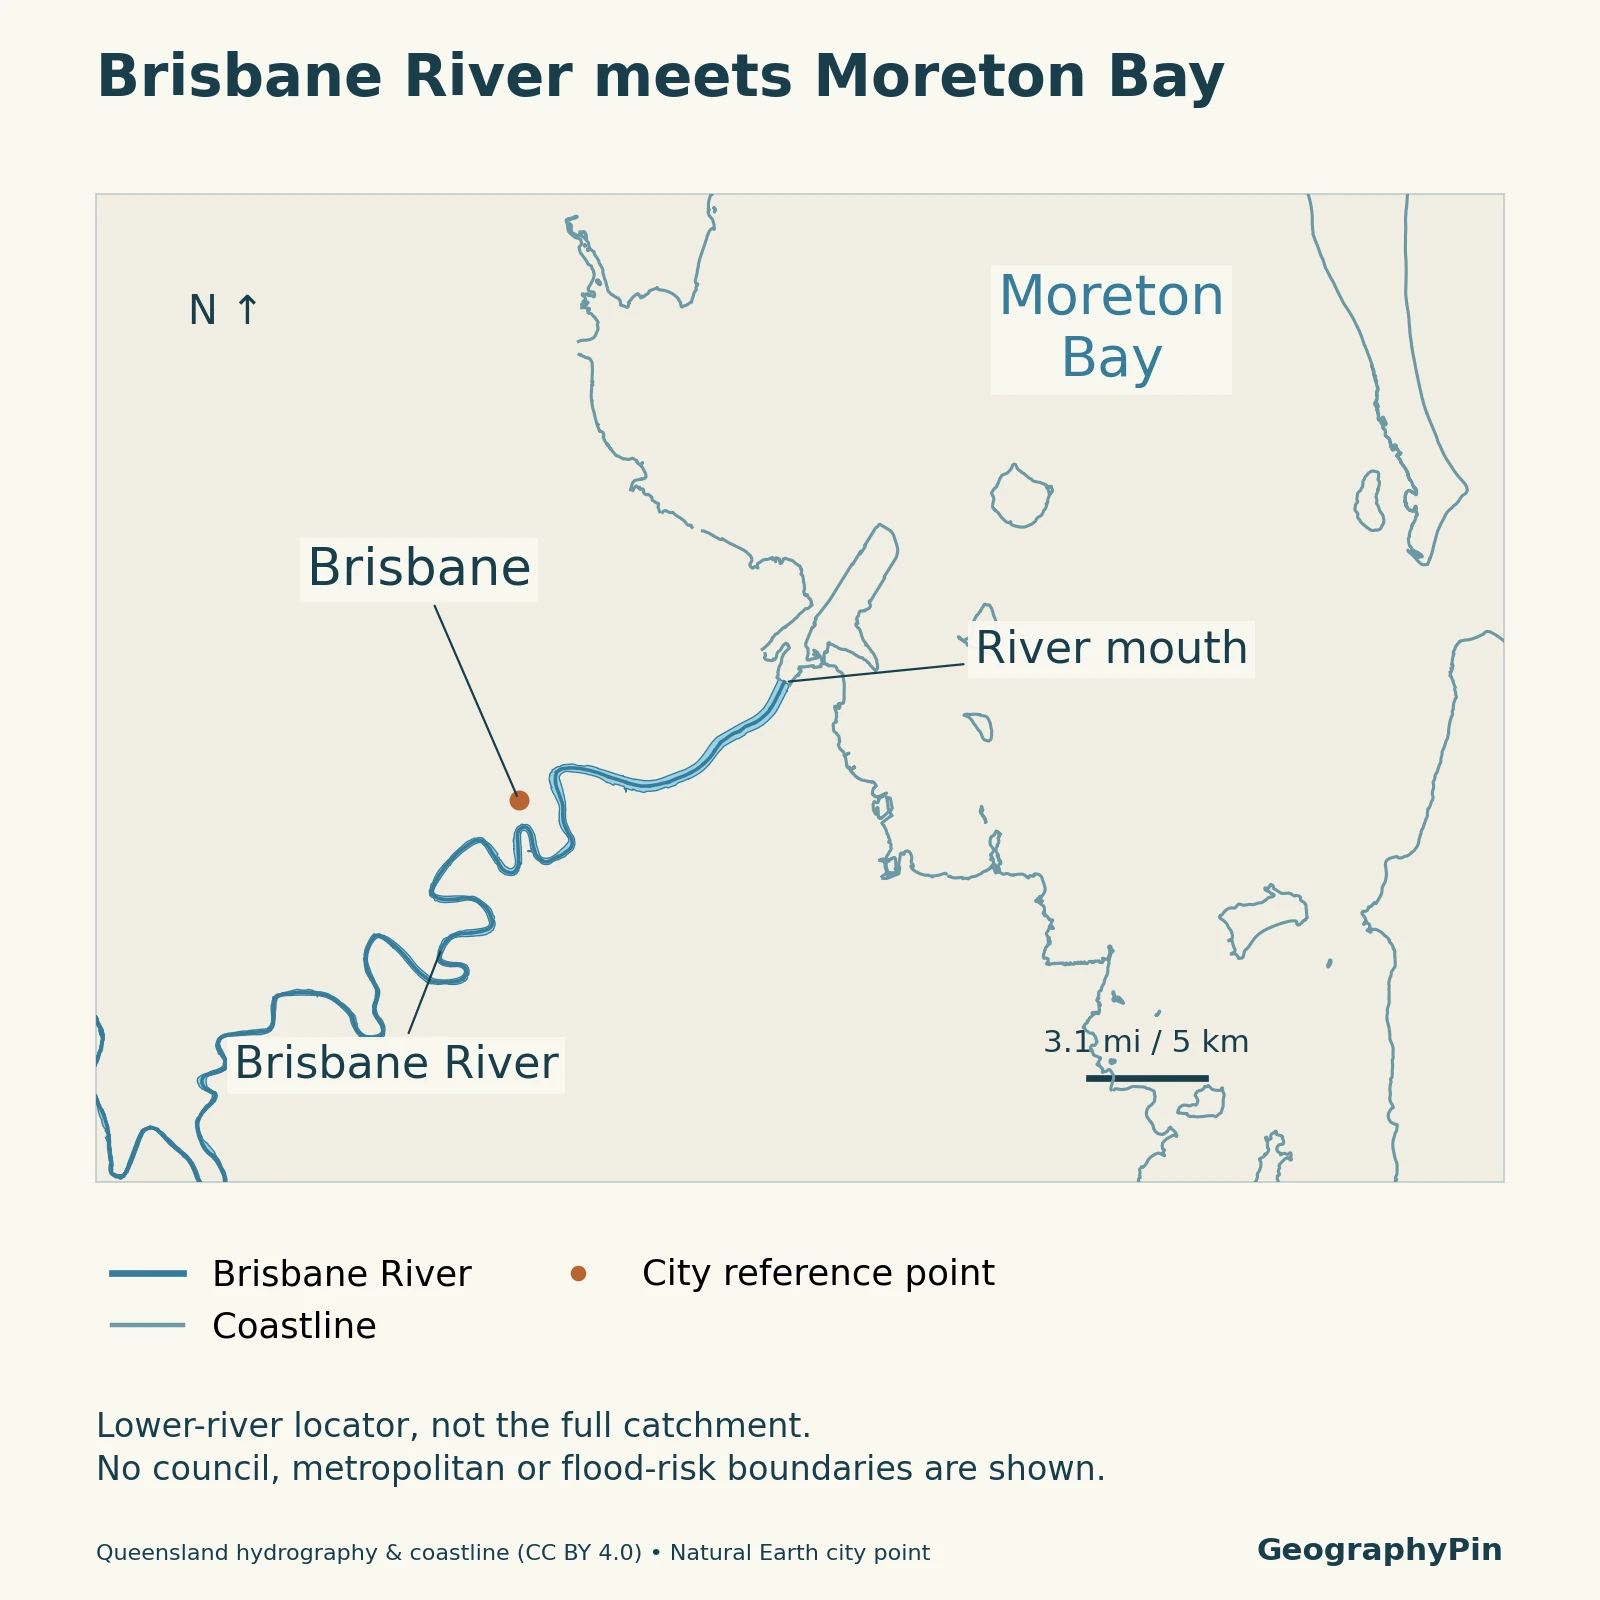
The river, bay and neighboring urban areas belong to different geographic frames. A map of central Brisbane shows only a small portion of the river system, while a regional map can include places administered by councils other than Brisbane City Council. Neither view should be mistaken for the whole river catchment.
2. Brisbane River and the floodplain
The channel is only part of the river landscape
The Brisbane River drains a basin extending far beyond the central city. Water arriving downstream can come from rainfall well away from the skyline. Important tributary systems include the Bremer River, which joins the Brisbane River at Moggill, and the Lockyer–Laidley system farther upstream.
The lower river is also tidal. The Bureau of Meteorology describes tidal influences extending inland to Mount Crosby. This is a statement about water-level influence, not a claim that seawater always reaches that point or that tides alone determine river conditions.
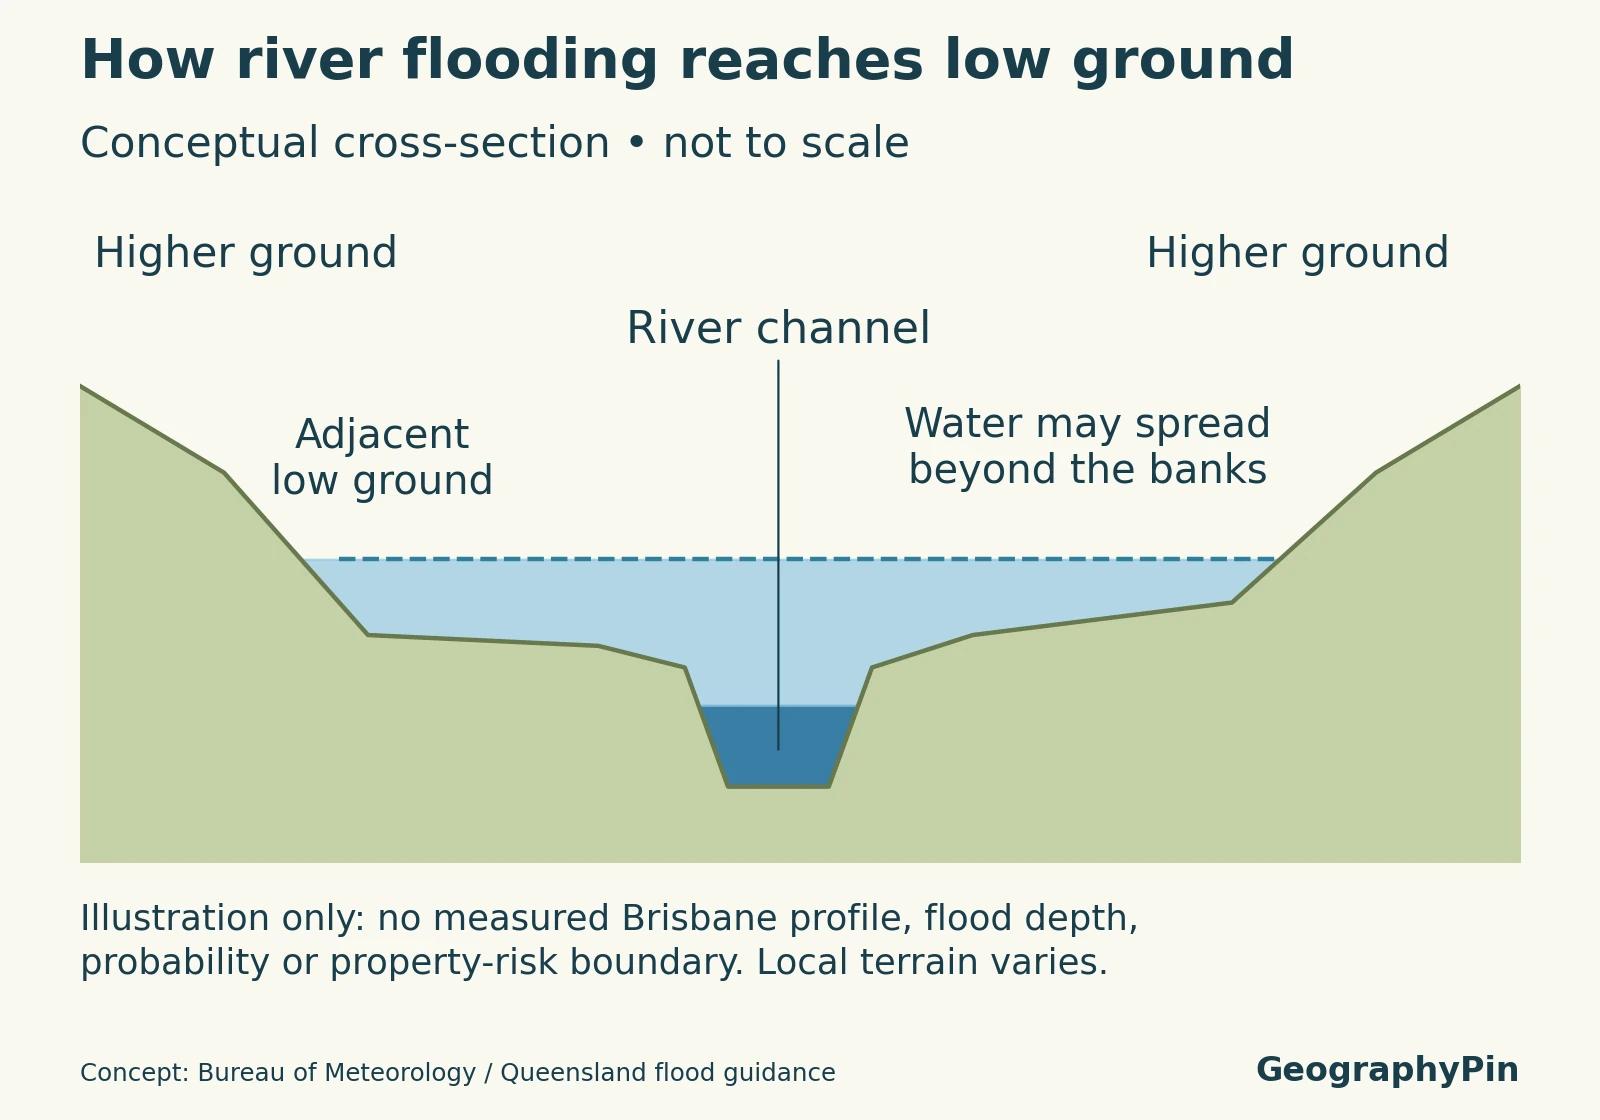
A floodplain is low-lying land beside a channel that can be covered when water spreads beyond the channel. The schematic below illustrates that relationship. Its water surface is an example of the process, not the measured level or footprint of a Brisbane flood.
Brisbane is not one continuous flat floodplain. Queensland’s Lower Brisbane catchment account describes contrasting rock formations, undulating terrain and areas of river-deposited sediment. It identifies relatively limited alluvium along parts of the main channel and more extensive deposits along other waterways. Hills and valleys are therefore as important to the city’s geography as the visible river bends.
Creeks add another layer. Oxley, Norman, Bulimba, Enoggera and Breakfast creeks form parts of the lower river’s drainage setting. Some other northern waterways, including Kedron Brook, drain toward Moreton Bay without joining the Brisbane River. A creek’s direction of drainage matters more than simply being near the city.
3. Moreton Bay and the coast
An estuarine bay is different from the ocean-facing coast
Moreton Bay lies east of the city and receives water from the Brisbane River and other waterways. Queensland Parks describes it as an estuarine bay: a coastal environment influenced by river discharge and the sea.
Mulgumpin (Moreton Island) and Minjerribah (North Stradbroke Island) shelter the bay from much of the ocean’s wave and wind exposure. Their seaward coasts and the mainland’s sheltered foreshores are not interchangeable environments. The islands do not seal the bay off from the sea.
The wider marine setting includes mangroves, saltmarsh, seagrass meadows, sandy beaches and reefs. These habitats occupy different positions relative to tides, sediment and water conditions. A river mouth, a tidal wetland and an ocean beach can be geographically close while functioning quite differently.
Moreton Bay Marine Park is a protected area with defined boundaries and zones. It includes much of the bay’s tidal water and additional waters, so its reported area should not be used as the area of the bay itself.
4. Hills and the wider urban region
Brisbane City Council and Greater Brisbane describe different areas
Mount Coot-tha is a useful reminder that Brisbane’s landscape includes wooded hills as well as low ground. Its lookout faces across the city toward Moreton Bay. The contrast between elevated slopes and river or creek valleys helps explain why neighboring districts can have noticeably different terrain.
The Brisbane Local Government Area, or LGA, is the area administered by Brisbane City Council. The council divides it into 26 electoral wards. This is an administrative boundary, not the edge of every continuous suburb or the boundary of the Brisbane River basin.
For statistics, the Australian Bureau of Statistics defines Greater Brisbane as a Greater Capital City Statistical Area, or GCCSA. This represents a broader functional region connected to the capital city. It is not a second municipal government, and it should not be treated as just another name for the Brisbane LGA.
The distinction is useful when reading population comparisons. A larger geographic unit can have many more residents without contradicting a smaller unit’s total. It also illustrates the difference between physical geography, which examines landforms and natural processes, and boundaries created for government or statistical reporting.
5. Why flood exposure varies
Four sources can affect different parts of the landscape
Brisbane City Council distinguishes four common flood sources. They can interact, but they are not the same process:
| Source | What drives it |
|---|---|
| River flooding | Water from prolonged catchment rainfall raises river levels and can spread onto adjacent land. |
| Creek flooding | Rainfall and runoff within a creek catchment raise the creek; high river levels can also affect its outlet. |
| Overland flow | Excess rainfall moves across land and along local drainage paths, influenced by streets, structures and drainage systems. |
| Storm tide or high tide flooding | Elevated coastal water levels can affect low-lying foreshores and tidal waterways. |
Rainfall intensity and duration, conditions before the rain, channel capacity, ground cover, slope and tides all influence the outcome. A single elevation value or distance from the main river cannot capture those interacting controls. The same neighborhood need not experience identical effects in different events.
Wivenhoe Dam reduces the frequency of flooding in Brisbane, but it does not eliminate major floods. The broader drainage network includes tributaries and local runoff downstream of the dam. Its presence is therefore not a reason to assume every riverside or creek-side location is protected.
For an address-specific assessment, use Council’s Flood Awareness Map and its FloodWise Property Report. These are different from this article’s explanatory map and diagram. The awareness map gives general flood information; the property report supplies technical planning information where available. Neither the locator nor the schematic here identifies safe properties or evacuation routes.
6. Key facts and geographic boundaries
| 2021 geographic unit | People, usual residence |
|---|---|
| Brisbane LGA (LGA31000) | 1,242,825 |
| Greater Brisbane GCCSA (3GBRI) | 2,526,238 |
Both totals are from ABS 2021 Census QuickStats, using the geographic units attached to that census. They are shown to illustrate the difference in scope, not as current population estimates. The Greater Brisbane figure includes a wider region than the council-area figure.
Keep the reference year, boundary and measurement together. Census counts and later estimated resident populations are different products; a newer statistical boundary should not silently be substituted into an older table. The same discipline applies to physical measurements: a whole catchment’s area is not the city’s area, and a river-gauge reading is not a flood depth at every nearby property.
Frequently Asked Questions
Does a “1-in-100-year flood” happen only once every century?
No. A 1% annual exceedance probability means a flood of that size or larger has a 1% chance in any given year. It is not a timetable or a guarantee of 100 flood-free years after an event.
What Did We Learn Today?
Brisbane’s geography joins a winding, tidal lower river with creek valleys, hills and the sheltered waters of Moreton Bay. The landscape is not uniformly flat, and flooding can come from several interacting sources. Brisbane City Council’s area, Greater Brisbane and the river catchment are different geographic units, so maps and statistics are useful only when their scope is clear.
Sources & Data Notes
The population comparison uses 2021 Census usual-residence counts and their census geographic units, not current population estimates. The floodplain cross-section is conceptual, not to scale and not a surveyed Brisbane transect, property-risk assessment or forecast. Official flood mapping and warnings should be used for location-specific decisions.
Map method: The locator uses Queensland Government hydrographic features and coastline data, reused under CC BY 4.0. The Brisbane reference point comes from public-domain Natural Earth data. Shorelines are linework, not a land-cover classification; some smaller waterways are omitted. Source features have varying acquisition dates, so the outline is not presented as a single current survey. The diagram illustrates a general river-flood process, not a section measured along the locator.
Featured photograph: Brisbane River and skyline, MusikAnimal, February 21, 2014. Cropped, resized and converted; the adapted photograph remains available under CC BY-SA 4.0. It shows the skyline in 2014, not its present appearance.
- Bureau of Meteorology: lower Brisbane River: Tributaries, tides and the limits of flood mitigation.
- Queensland WetlandInfo: Lower Brisbane catchment: Terrain, alluvium and local drainage relationships.
- Queensland Parks: Moreton Bay Marine Park: Bay, offshore islands, habitats and protected-area scope.
- Brisbane City Council: Mt Coot-tha: Hill and city-to-bay setting.
- Brisbane community profiles: The council-area definition and wards.
- ABS statistical geography: Functional capital-city regions; distinct from local government.
- ABS: Brisbane LGA, 2021 Census: The historical council-area population.
- ABS: Greater Brisbane, 2021 Census: The historical GCCSA population.
- Brisbane City Council: check your risk: The four common flood sources.
- Geoscience Australia: floods: Physical factors controlling flooding.
- Queensland: flood terms: Catchment, cross-section and annual-probability terminology.