A map of China becomes easier to read when height, water and distance from the sea are considered together. The high Tibetan Plateau, the dry Tarim Basin and the lower eastern plains are not variations of one landscape. Their contrasts help explain river routes, regional climates and the very different settings of cities such as Beijing, Chengdu and Shanghai.
China lies in East Asia, facing the western Pacific. Its physical geography broadly descends from high western plateaus through inland basins and uplands toward eastern plains and coasts. Major rivers connect some of these regions, while enclosed basins drain internally. Population figures and political maps need explicit territorial coverage rather than an assumed universal outline.
How to use this article: Start with the map’s scope, compare contrasting basins, or follow drainage connections.
1. Locate China in its East Asian setting
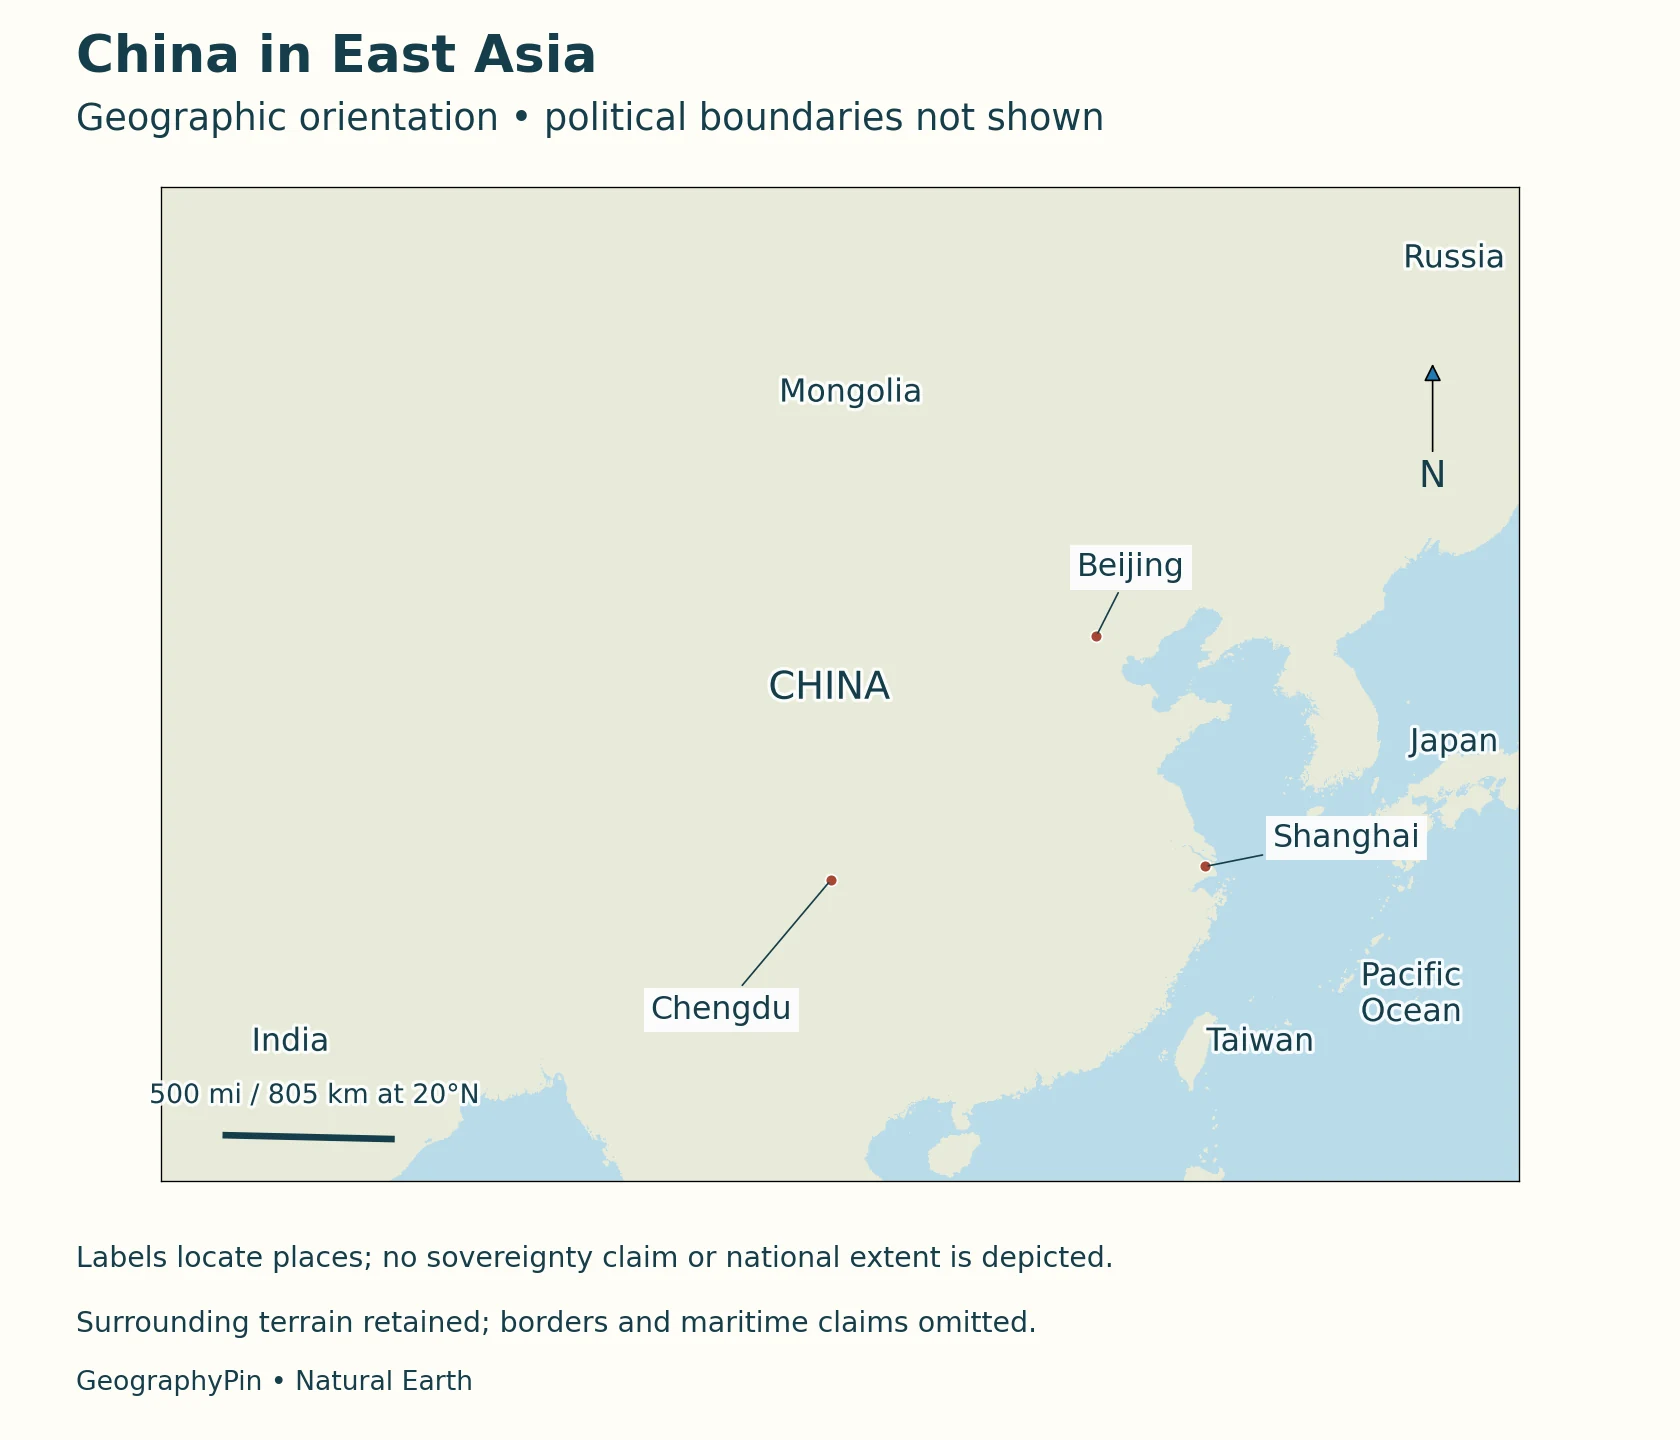
China occupies an extensive part of eastern Asia. Continental interiors lie to its west and north, while the coast faces the Bohai, Yellow, East China and South China seas. Beijing, the national capital, lies in the north; Shanghai is near the Yangtze estuary on the eastern coast. These two cities are useful reference points, but neither captures the enormous variety of the interior.
Around the land perimeter are North Korea and Russia in the northeast and north; Mongolia to the north; Kazakhstan, Kyrgyzstan and Tajikistan toward the northwest and west; Afghanistan and Pakistan toward the west; India, Nepal and Bhutan along the southwestern and Himalayan side; and Myanmar, Laos and Vietnam to the south. This lists neighboring countries, not an assertion that every boundary segment is agreed. Japan lies across the sea, not on a land border.
A geographic locator is not a boundary ruling
The maps here emphasize terrain, coastlines and named locations rather than coloring contested territories as though their status were undisputed. They do not draw international boundary lines or maritime claims. Taiwan is identified geographically as a separate island; the maps do not resolve sovereignty disputes. Statistics below follow the coverage stated by the agency that produced them, not an area inferred from the map.
2. Read country facts with their date and coverage
The National Bureau of Statistics reported 1,404.89 million people at the end of 2025. Its stated coverage is the population of the mainland’s 31 provinces, autonomous regions and municipalities plus servicemen. The figure excludes residents of Hong Kong, Macao and Taiwan and foreigners living in those 31 provincial-level units. That scope is essential to interpreting the number.
| Item | Fact | Reference or limit |
|---|---|---|
| Capital | Beijing | Constitution, Article 143 |
| Population | 1,404.89 million | End of 2025; NBS coverage described above |
| Urban share | 67.89% | End of 2025; NBS statistical classification |
| National standard language | Putonghua (Standard Mandarin); standardized Chinese characters | Revised law effective January 1, 2026 |
| Physical orientation | High western plateaus, inland basins and lower eastern regions | Broad pattern; not uniform elevation zones |
A later publication can describe an earlier date
Publication date and population reference date are different things. The one-percent sample survey released in May 2026 referred to November 1, 2025, not the date it appeared online. A city population can also refer to a municipality, an urban area or a wider metropolitan region. Comparing such totals without checking their definitions can produce a misleading ranking even when each individual number is correctly copied.
3. Follow the broad descent from western plateaus to eastern plains
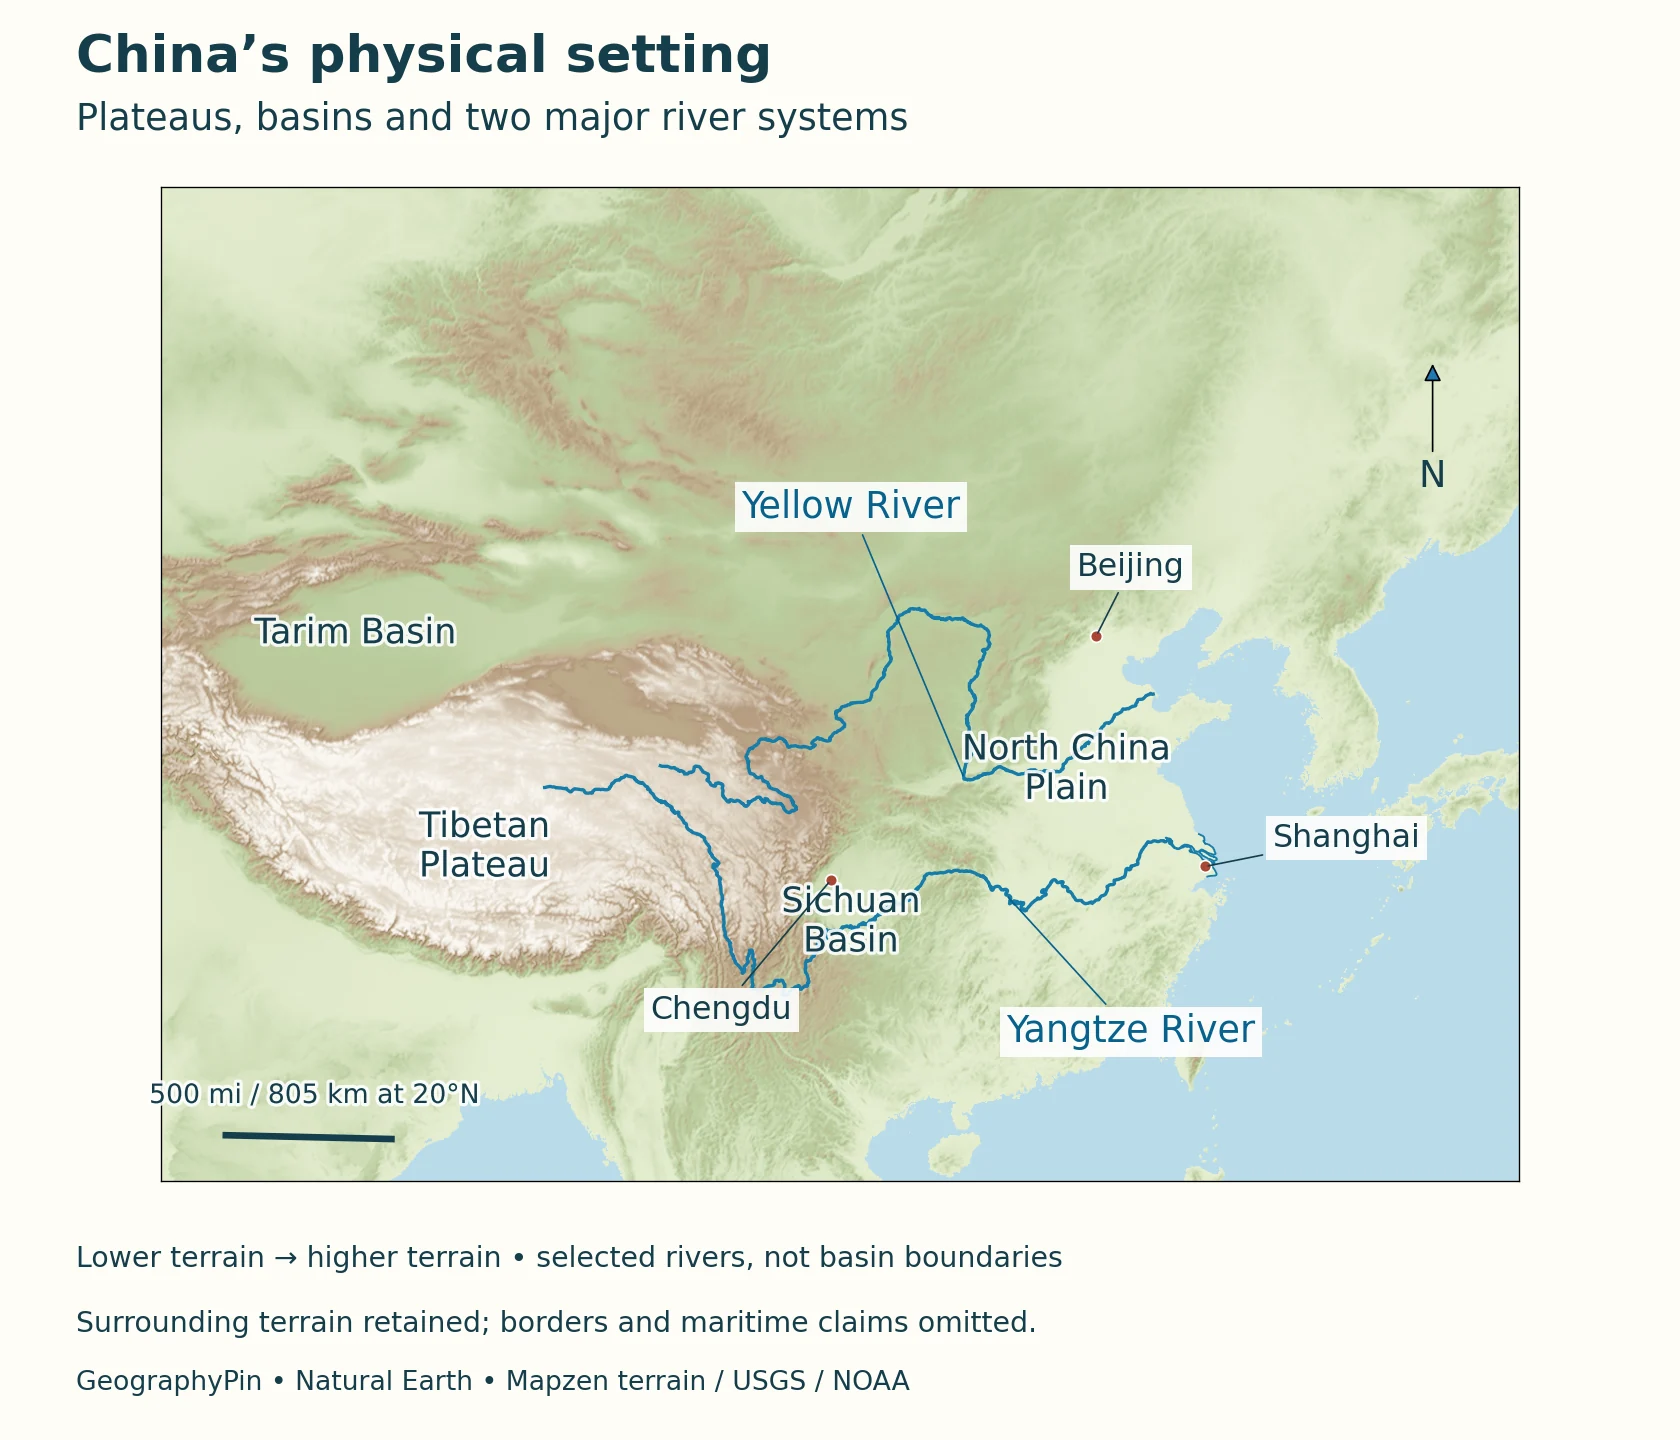
The west-to-east pattern is a useful first approximation, not a staircase of three perfectly flat surfaces. Mountains, valleys and basins interrupt it. The Tibetan Plateau occupies a large high-elevation region in the southwest, while other western landscapes include much lower enclosed basins. Farther east, uplands and broad plains alternate before the land meets the sea.
A basin is not necessarily low compared with the coast
The Tarim Basin lies between major mountain systems in the northwest. Its desert interior contrasts with the wetter high ground that supplies runoff. NASA’s paired winter and summer images show vegetation following water along the mountain margins and river corridors. The Hotan River provides an example of runoff crossing desert toward the Tarim. A basin’s position below its surrounding mountains does not mean that it lies at sea level or drains to the ocean.
The Sichuan Basin provides a different contrast. It lies beside much higher terrain to the west, but its own surface is not uniformly flat. NASA imagery of the northeastern basin shows long, roughly parallel ridges separated by cultivated valleys. Moist air rising over these ridges can form lines of cloud. Thus, both the dry Tarim and the moist Sichuan landscape are called basins, even though their climate, vegetation and local relief differ substantially.
To the east, the North China Plain and the plains along the middle and lower Yangtze provide extensive lower ground. They are distinct regions rather than one uninterrupted coastal plain. Reading the relief map together with rivers helps locate these lowlands without treating every place east of the plateau as equally low or equally wet.
4. Distinguish rivers reaching the sea from inland drainage
The Yellow River and Yangtze are major eastward river systems, but their routes and sediment stories differ. The Yellow River rises in the Bayan Har Mountains of Qinghai and carries sediment from the Loess Plateau toward the Bohai coast. Its delta is a changing depositional landscape, not a fixed outline that can be treated as timeless. NASA’s comparison of dated images also documents engineered changes to the river mouth.
The Yangtze connects Tibetan headwaters with mountainous upper reaches, the Three Gorges region and lower plains before reaching the East China Sea. A 2023 river-research account divides the main course at Yichang and Hukou: upper reaches end at Yichang, the middle section continues to Hukou, and the lower section runs downstream from there. Satellite images of its coastal plume demonstrate how river-borne sediment can extend beyond the shoreline into the receiving sea. The visible color of such a plume is not, by itself, a water-quality test. Likewise, the outline of a delta on an old satellite image should not be presented as a survey of today’s coast.
Drainage requires connections, not just nearby labels
Inland drainage works differently. Water entering an enclosed basin does not follow a continuous river route to the ocean. It may be stored, diverted, infiltrate into the ground or evaporate. A map showing two rivers close together is not evidence that they join. The generalized river lines here help explain regional connections, but they are not navigation charts or a complete inventory of tributaries, irrigation channels and seasonal flows.
5. Compare monsoon regions, dry interiors and high mountains
The national climate report distinguishes the monsoon-influenced east, the continental northwest and the high plateau’s alpine conditions. This broad division is more useful than describing all of China with one temperature or rainfall average. Elevation, distance from moisture sources and the seasonal movement of air all matter.
In much of the eastern monsoon region, warmth and rainfall are concentrated in the warmer part of the year. That pattern does not mean that every eastern location has the same rainy season or that winters are identical from north to south. Northwestern basins can be dry even when nearby mountains supply rivers. On the plateau, high elevation creates a different temperature setting from lowlands at a similar latitude.
The Sichuan ridge example shows the importance of local topography within a broad climate region. Air forced upward cools, which can encourage cloud formation when enough moisture is present. In the Tarim region, mountain-fed water supports a landscape that rainfall over the desert alone cannot explain. Neither a single cloudy satellite scene nor one unusually wet year is a substitute for a long-term climate record.
6. Connect settlement to terrain without reducing people to a map
The 2020 census offers one dated way to describe regional population distribution: the NBS eastern statistical region contained 39.93 percent of the national population at the census reference date. That is a regional population share, not a statement that 39.93 percent occupied the coastline itself. The NBS western region includes Sichuan and Chongqing as well as plateau and desert regions, so the statistical labels cannot simply be substituted for physical terrain zones.
At the end of 2025, the NBS urban share was 67.89 percent. Urban and rural classifications describe where people live under statistical rules; they do not tell us whether a particular city is coastal, mountainous or on a plain. Nor does a municipality’s administrative area necessarily match its continuously built-up area. These distinctions help keep a national overview separate from a ranking of city populations.
Standard language does not mean a uniform linguistic landscape
The national standard spoken and written language is Putonghua, or Standard Mandarin, and standardized Chinese characters. The revised language law effective January 1, 2026 also recognizes the freedom of ethnic groups to use and develop their languages. A national language label is therefore not a claim that every household uses the same language or that regional speech and writing traditions are interchangeable.
7. Use named places to connect landscape and economic activity
Shanghai illustrates the meeting of inland waterways and maritime connections. The municipality faces the Yangtze estuary, the East China Sea and Hangzhou Bay. Its port geography includes facilities on the Huangpu River and the Shanghai reach of the Yangtze as well as the offshore Yangshan deep-water port. The relationship between a river hinterland and the sea is more informative here than a timeless claim about a port’s rank or annual cargo total.
Chengdu offers an inland comparison: it belongs to the Sichuan Basin setting rather than the eastern coast. The basin’s cultivated valleys and surrounding mountain relief show why “inland” is not synonymous with desert or high plateau. Beijing, in turn, is the national capital, not a coastal river-mouth port. Locating these three cities on the same physical map helps distinguish different settings without pretending that terrain alone determines their development.
Geography provides opportunities and constraints, not a complete explanation of an economy. Water supply, cultivable land and transport corridors interact with infrastructure, institutions and decisions made over time. A map of elevation cannot measure present income, employment or industrial output. For those questions, use dated statistics with a defined region rather than assigning economic conditions from the color of the terrain.
What Did We Learn Today?
China’s broad west-to-east elevation pattern provides a starting point for understanding its plateaus, basins, rivers and plains, but local contrasts remain important. Tarim and Sichuan illustrate why two basins can have very different climates and water systems. Political coverage, population reference dates and map conventions must be stated clearly, while physical maps explain landscapes without settling territorial disputes.
Sources & Data Notes
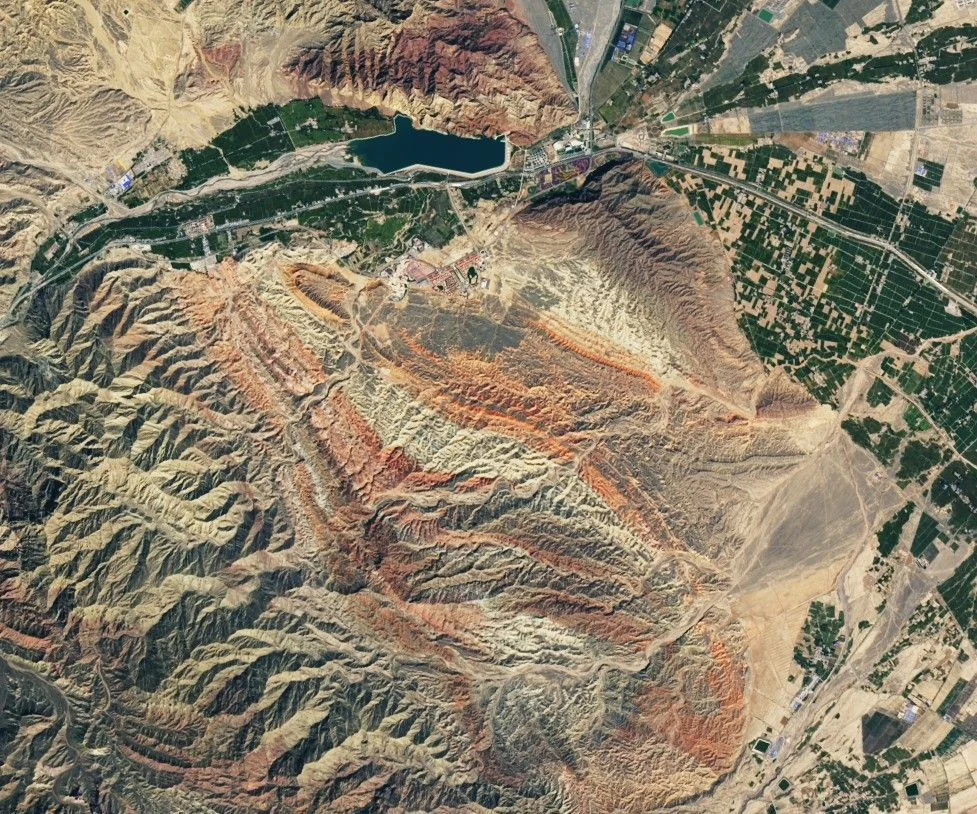
Population is an end-2025 estimate under the stated NBS coverage; the separate 2020 regional share uses census definitions. Historical satellite images illustrate named landscapes, not current conditions. Maps use actual Mapzen terrain and generalized Natural Earth geometry, with political borders and maritime claims omitted. Terrain sources include USGS SRTM/GMTED2010 and NOAA ETOPO1. Region labels are approximate; no basin or elevation-step boundaries are inferred. The Yangtze system uses named Natural Earth headwater and main-channel segments; its estuary is shown by actual generalized coastal geometry rather than an interpolated connection. The Mercator scale bar is referenced to 20°N and varies with latitude. The featured image shows Qilian foothill terrain near Zhangye on September 17, 2020: NASA Earth Observatory image by Lauren Dauphin, using USGS Landsat data. It was converted to WebP without changing the scene.
- National Bureau of Statistics: end-2025 population and urban share
- NBS 2025 sample survey: reference date and statistical definitions
- NBS Seventh Census: 2020 regional population distribution
- Constitution: capital, Article 143
- Revised standard-language law, effective January 1, 2026
- China Third National Communication: physical and climate context
- CCAM research: broad physical setting and catchment data
- NASA: winter and summer in the Tarim Basin
- NASA: Sichuan ridges and orographic clouds
- NASA: Yellow River delta and dated coastal change
- NASA: Yangtze sediment entering the East China Sea
- Shanghai municipal government: geographic setting
- Shanghai port office: geographic water-area context
- NASA: Red Rocks and Rainbow Ridges, image and credits
- Natural Earth data and public-domain terms
- Mapzen terrain source attribution
- Lu and colleagues, 2023: Yangtze river reaches and sediment dynamics
- CFE-DM Northeast Asia handbook, April 2026: neighboring-country list, page 9