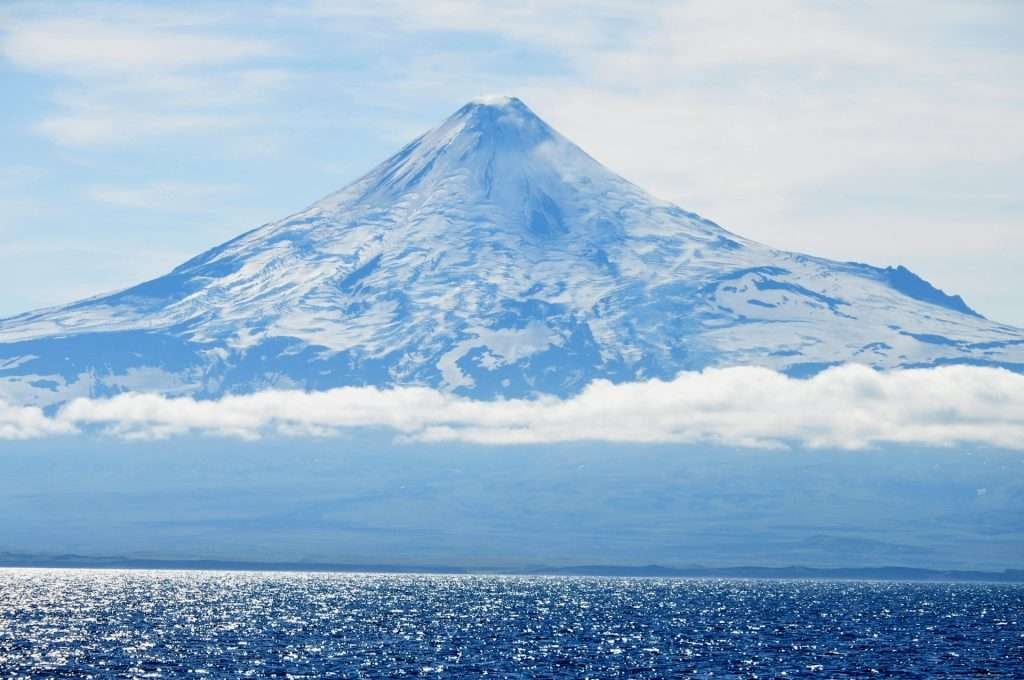
A country can have many volcanoes without having the most recent eruptions. The answer depends on whether you count the long geological record, volcanoes that have erupted within a particular historical period, or eruptions continuing at a particular date. Keeping those questions separate makes the rankings much more useful.
One question, two leading countries
The United States leads the Smithsonian Global Volcanism Program’s published country table with 165 Holocene volcanoes. Indonesia leads the historical activity measures, with 71 volcanoes recorded as erupting since 1800 and 55 since 1960. These are counts of volcanoes, not individual eruptions, and they do not rank danger or eruption frequency.
Choose the comparison you need: Start with the long-term inventory, compare recent historical activity, or check dated eruption reports.
What counts as a volcano in these rankings?
The Global Volcanism Program (GVP), part of the Smithsonian Institution, compiles information on volcanic systems and their eruptions. Its Holocene inventory covers roughly the last 12,000 years. Evidence can include witnessed eruptions, dated deposits and other geological assessments; the catalogue distinguishes different levels of evidence rather than treating every entry as an equally well-documented historical eruption.
A named volcanic system may contain several vents or cones. Counting every visible cone would therefore produce a different answer. These tables follow GVP’s own units and country assignments instead of combining unrelated national inventories.
- Holocene volcanoes: the long-term catalogue used for the first ranking.
- Since 1800 or 1960: volcanoes with recorded eruptions within that historical window. A volcano that erupted repeatedly still counts once in each applicable column.
- Current eruptions: a separate, dated status assessment. It is not another name for the Holocene total.
Countries with the most Holocene volcanoes
The United States leads the published inventory
The United States has 165 entries in the country table, followed by Japan with 116 and Russia with 106. This comparison includes GVP’s geographic assignments, including relevant territories and offshore areas. It is not a count restricted to a country’s continental mainland.
Source: GVP country table retrieved November 19, 2026. Top 15 ranks shown, including both countries tied for 15th; therefore the table has 16 rows.
| Rank | Country label in GVP | Volcanoes |
|---|---|---|
| 1 | United States | 165 |
| 2 | Japan | 116 |
| 3 | Russia | 106 |
| 4 | Indonesia | 101 |
| 5 | Chile | 90 |
| 6 | Ethiopia | 49 |
| 7 | Papua New Guinea | 39 |
| 8 | Ecuador | 36 |
| 9 | Iceland | 35 |
| 10 | Argentina | 32 |
| 11 | Mexico | 30 |
| 12 | Canada | 24 |
| 13 | New Zealand | 23 |
| 13 | Philippines | 23 |
| 15 | Kenya | 21 |
| 15 | Tonga | 21 |
The lower positions are worth reading carefully. New Zealand and the Philippines share 13th place with 23 volcanoes each; Kenya and Tonga share 15th with 21 each. Giving tied countries consecutive ranks, or omitting one of them to force a fixed number of rows, would misrepresent the comparison.
Which countries have the most recently active volcanoes?
Indonesia leads both historical windows
Indonesia leads when the question is how many volcanoes have recorded eruptions since 1800 or since 1960. These windows answer a different question from the Holocene inventory. They also depend on the completeness of observations and historical records, which vary across regions and periods.
Volcanoes with recorded eruptions since 1800
| Rank | Country label in GVP | Volcanoes |
|---|---|---|
| 1 | Indonesia | 71 |
| 2 | United States | 63 |
| 3 | Japan | 61 |
| 4 | Russia | 46 |
| 5 | Chile | 35 |
| 6 | Papua New Guinea | 20 |
| 7 | Ecuador | 17 |
| 8 | Tonga | 15 |
| 9 | Iceland | 14 |
| 9 | Philippines | 14 |
Iceland and the Philippines share ninth place. Indonesia’s total of 71 means 71 different volcanoes in this column, not 71 eruptions across the country.
Volcanoes with recorded eruptions since 1960
| Rank | Country label in GVP | Volcanoes |
|---|---|---|
| 1 | Indonesia | 55 |
| 2 | Japan | 40 |
| 3 | United States | 39 |
| 4 | Russia | 27 |
| 5 | Chile | 19 |
| 6 | Papua New Guinea | 13 |
| 7 | Ecuador | 12 |
| 8 | Iceland | 10 |
| 9 | Tonga | 9 |
| 9 | United Kingdom | 9 |
| 9 | Vanuatu | 9 |
Iceland is eighth with 10. Tonga, the United Kingdom and Vanuatu each have nine and share ninth place, so the top 10 ranks contain 11 country entries. The United Kingdom’s appearance reflects GVP’s geographic grouping, including overseas volcanic areas; it does not mean nine volcanoes have erupted on the island of Great Britain since 1960.

Why so many volcanoes occur around the Pacific
Many leading countries lie along convergent plate boundaries, where one tectonic plate descends beneath another. Water released from the descending plate helps melting in the mantle above it, supplying magma to volcanic arcs. Indonesia, Japan, the Aleutian arc and the Andes illustrate why the Pacific margins are so prominent in these rankings.
Plate boundaries are not all alike, however. Volcanoes also form where plates pull apart, including spreading ridges and continental rifts. Iceland straddles the Mid-Atlantic Ridge, while East African rifting helps explain volcanic landscapes in Ethiopia and Kenya. Hotspots provide another setting, with Hawaii as a familiar example. A country’s position on a map is only the starting point for understanding its volcanic systems.
Nor does a larger inventory automatically mean greater danger to a particular traveler or community. Local risk depends on the volcano’s behavior, monitoring, the hazards it can produce, exposure and preparedness. A national ranking cannot replace advice from the responsible observatory or emergency authorities.
How to check eruptions without mistaking an old snapshot for today
Read the reporting date before the volcano list
For recent activity, use GVP’s current-eruptions page and Weekly Volcanic Activity Report, linked in Sources & Data Notes below. The weekly report summarizes selected reported activity during its stated period; it is not a guarantee that every eruption or change worldwide is included.
The country table used here labels its eruption-status column March 31, 2026. That is a historical status snapshot, not a live November count. We have not turned those entries into a “right now” leaderboard. A continuing eruption can also include pauses, so the term does not necessarily mean visible lava or ash at every moment.
What the country tables do and do not cover
All three rankings use the same 76 country-labeled rows actually present in the retrieved GVP table; Antarctica is kept outside the country rankings. These are the source’s geographic labels, not a separate United Nations membership list or a ruling on sovereignty. Offshore areas, territories and shared assignments affect how entries are grouped.
Shared assignments also mean that adding country totals is not a reliable way to calculate the world’s number of unique volcanoes. Likewise, a country absent from these top ranks is not necessarily free of volcanic hazards. The rankings faithfully compare the published table, not an independent exhaustive survey of every volcanic feature on Earth.
Frequently Asked Questions
Does the United States or Indonesia have the most volcanoes?
They lead different measures. The United States leads the retrieved GVP Holocene country inventory with 165. Indonesia leads the recorded-eruption windows since 1800, with 71, and since 1960, with 55.
Does “active” mean a volcano is erupting now?
Not necessarily. The word is used for different time spans. This article states the window explicitly: Holocene, since 1800 or since 1960. Current eruption status is a separate dated assessment.
Why does the United Kingdom appear in the recent-activity ranking?
GVP’s country assignments include overseas volcanic areas. Its total is not restricted to Great Britain. Use the individual GVP volcano records to understand which geographic areas contribute to a country grouping.
Is the country with the most volcanoes the most dangerous?
No. Volcano counts alone do not measure the likelihood, severity or consequences of an eruption at a particular place. Local monitoring, hazard information and official instructions are more relevant to a visit or emergency decision.
What Did We Learn Today?
The United States leads GVP’s published Holocene country inventory, while Indonesia leads both historical eruption windows examined here. Those answers are compatible because they measure different things. Clear time windows, complete treatment of ties and attention to geographic coverage make the tables useful; treating them as eruption-frequency rankings, live activity feeds or personal risk assessments does not.
Sources & Data Notes
- Smithsonian GVP: volcanoes by country, retrieved November 19, 2026. All three rankings were extracted from the same table and checked with two parsers. Competition ranks retain all ties at the cutoff. The page’s introduction says 78 countries plus Antarctica, but its retrieved table contains 76 country-labeled rows plus Antarctica. No missing rows have been invented.
- GVP Holocene volcano list and database information. The database citation identifies version 5.4.0, August 7, 2026. This version date, our retrieval date and the country page’s March 31 eruption-status date refer to different things. Country assignments are not globally unique volcano totals.
- GVP current eruptions and Weekly Volcanic Activity Report. Check their stated reporting periods rather than interpreting this article as a live eruption service.
- National Park Service: volcanic landforms and British Geological Survey: how volcanoes form, for subduction, spreading, rifting and hotspot context.
- Marc Szeglat’s Sinabung photograph, published on Unsplash February 19, 2018; the photographer describes an eruption in 2014. Retained under the Unsplash License. The caption uses Sumatra without reproducing the photo page’s inconsistent provincial location label.


