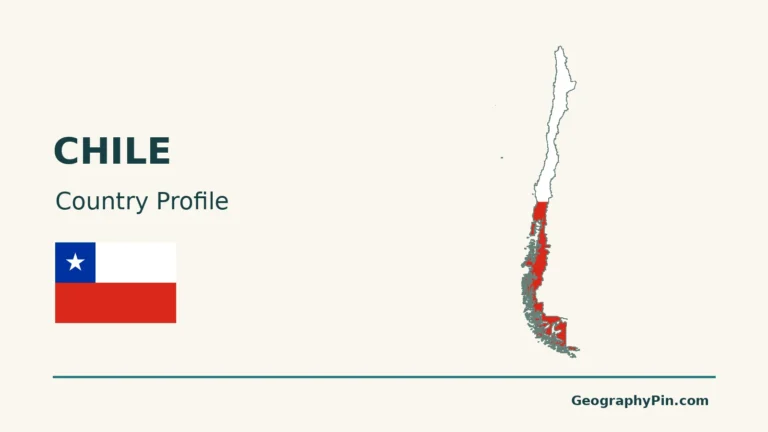
On an Atacama Desert map, look between the Pacific and the Andes in northern Chile. The landscape changes sharply from west to east: fog wets the coastal hills, very little rain falls in parts of the interior, and snow can land on the high plateau.
The Atacama Desert lies in northern Chile, east of the Pacific and west of the high Andes. Its driest interior includes parts of the Central Depression. The coastal hills can collect fog while the mountains receive more precipitation. An ecological outline and a map of extreme aridity do not draw the same edge.
How to use this article: Check which boundary the map uses, then compare the coastal fog oasis, the very dry inland station and snow on the high plateau.
Where the Atacama is and what the outline means
Separate an ecological edge from a dry-climate core
The Atacama is a desert of northern Chile between the Pacific and the Andes. Much of its driest country is in a long belt inland of the coast. The high Andes to the east are not simply a taller version of that belt: the terrain, water inputs and vegetation change as you climb.
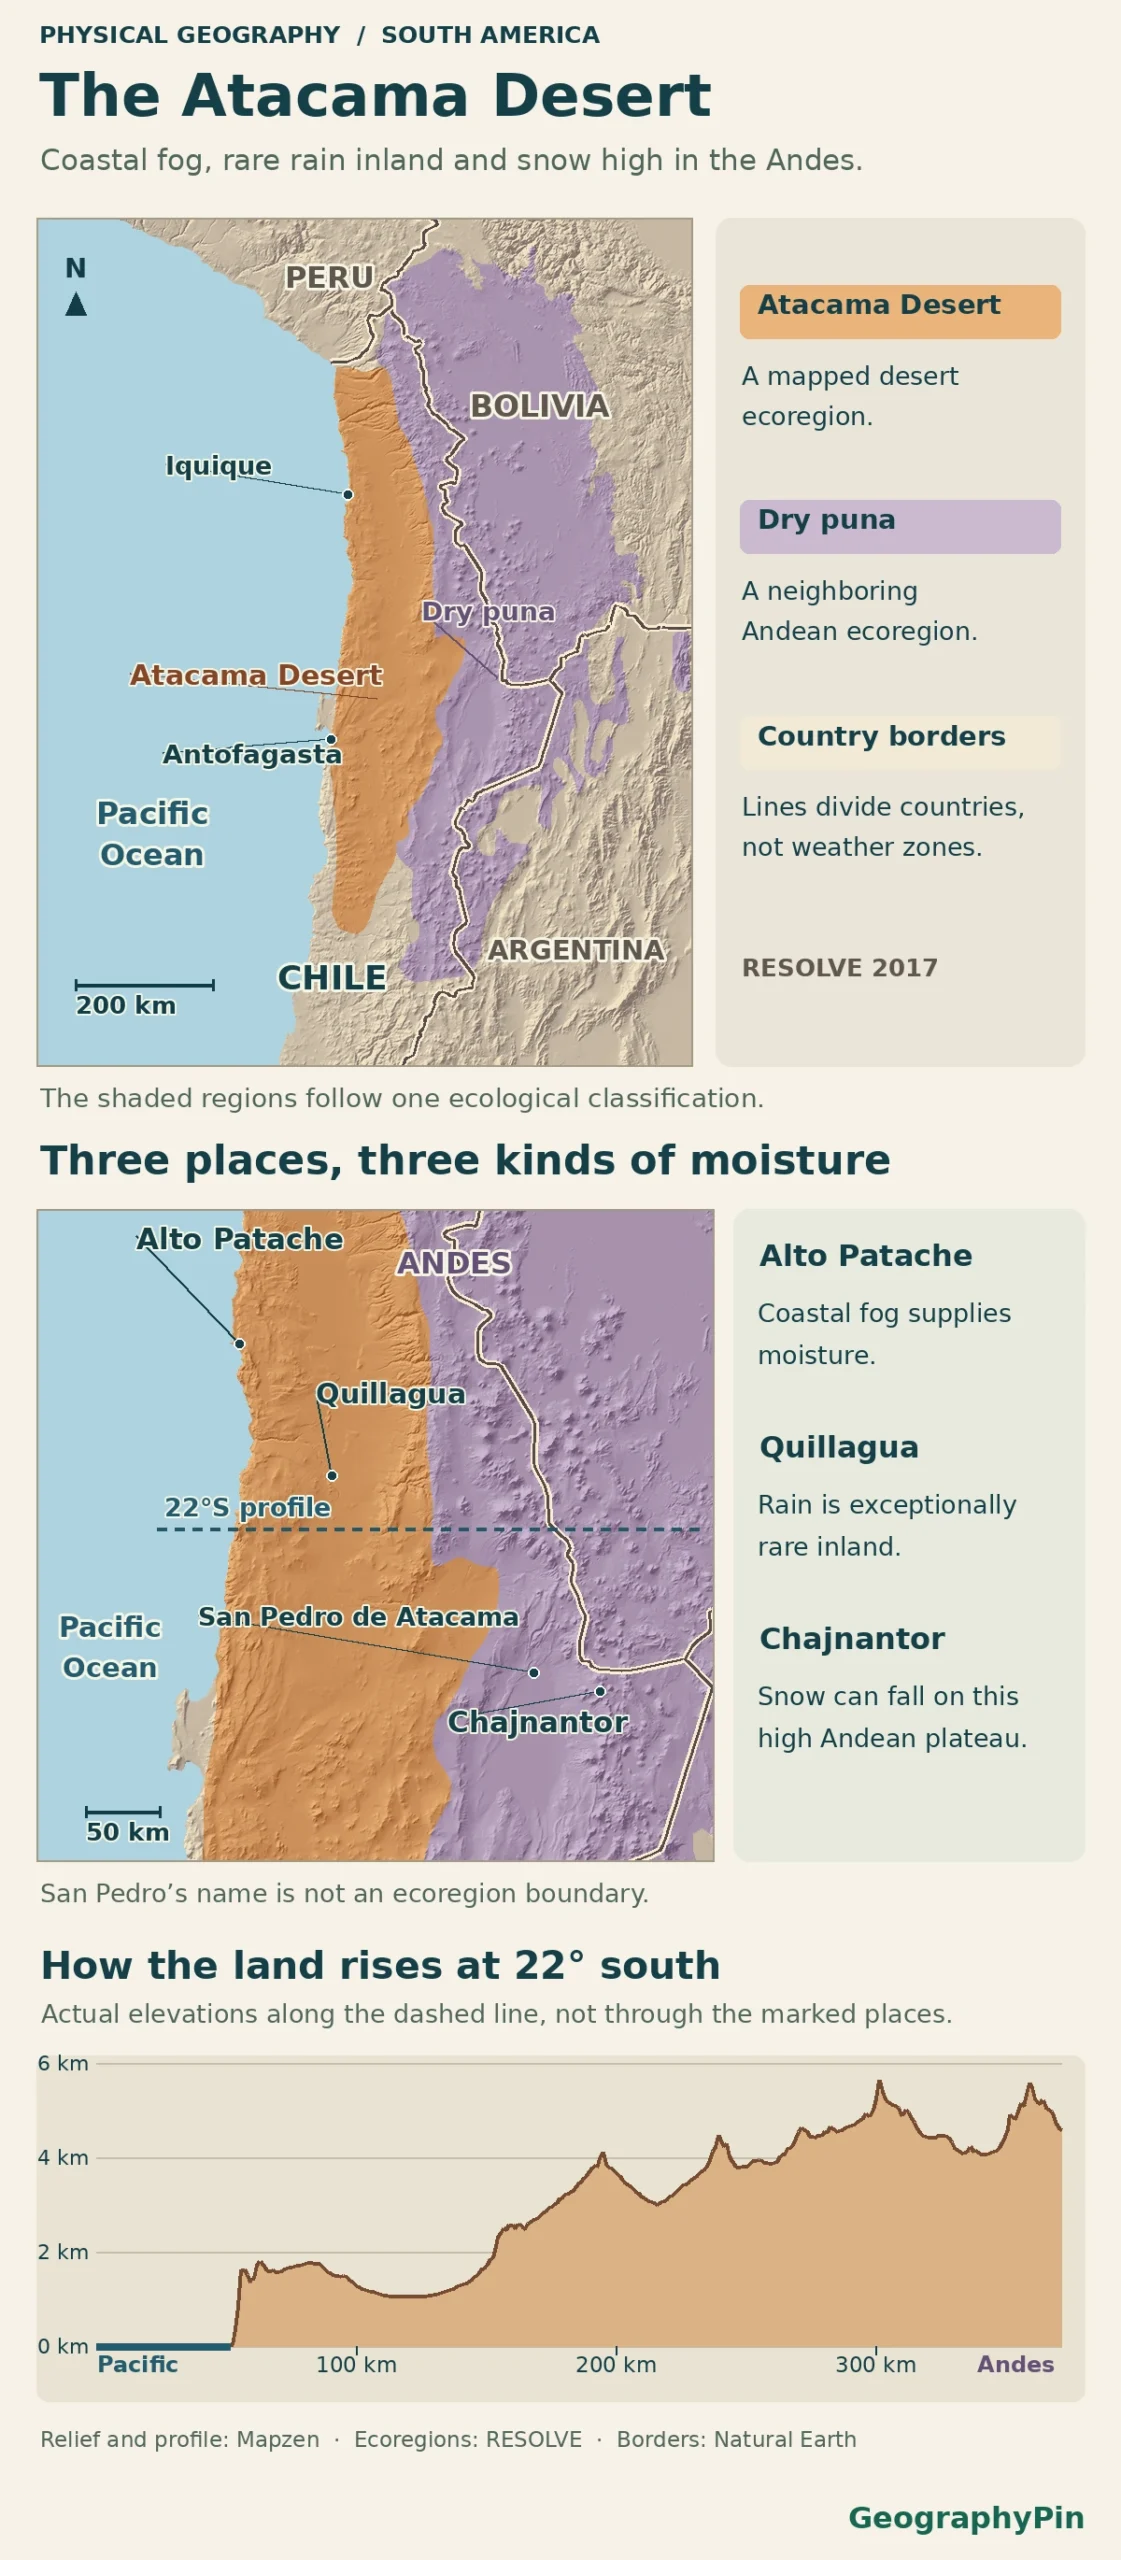
The RESOLVE Ecoregions 2017 shown here distinguish the Atacama Desert from neighboring Central Andean dry puna. The line groups landscapes by ecology, not a single rain threshold. Chile’s own 2020 ecoregion layer agrees at the four named sites. The elevation profile traces one separate line at 22°S, not a route through those sites.
Coastal range: where fog leaves water on the slopes
Start at the Alto Patache fog oasis
South of Iquique, moist Pacific air meets the Coastal Cordillera. The low cloud that reaches the slopes is known locally as camanchaca. It can leave droplets on plants and on mesh collectors without producing much rain at a ground gauge.
At Alto Patache, a multiyear field study found its highest fog-water collection at elevations of about 2,460 to 2,790 feet (750 to 850 meters). This is a local band measured by the researchers, not the height of fog all along the coast. Once you pass behind the coastal ridge, much of the low cloud no longer reaches the inland basin.
Central Depression: very little local rain, but not no water
Set Quillagua’s rain record beside the Loa River
East of the coastal mountains, the Central Depression contains broad low basins and plains. A climate-station study cites a historical mean of 0.15 millimeters a year at Quillagua. That number describes one site’s historical record. It is not a desert-wide mean, an annual promise or a claim that the town never sees rain.
Quillagua is also beside the Loa. The Library of the Chilean Congress traces that river from the mountains to the Pacific, and distinguishes the nearby Salar de Atacama as a closed basin, without an outlet to the sea. The amount of rain at a point, the origin of water in a river and where that river drains are three different things.
Andean plateau: what changes above the dry basin
Compare the interior with snow at Chajnantor
Continue across the mountains toward the high plateau. A study using regional rain-gauge records distinguishes the hyperarid interior, the precordillera and the higher Altiplano. The high terrain is more exposed to summer moisture arriving from inland South America. That seasonal pattern does not apply equally to every latitude or mountain slope.
At the ALMA observatory on the Chajnantor Plateau, the antennas sit about 16,400 feet (5,000 meters) above sea level. Snow photographed there is evidence of a cold, high-elevation event, not a rainfall measurement for the central basin. Neither that snow nor the coast’s fog contradicts the very low long-term rainfall measured at some inland sites.
Why two maps put the edge in different places
San Pedro de Atacama makes the distinction easy to test. Despite the name, its town-center point falls in Central Andean dry puna when checked against the 2017 layer shown here and the ministry’s 2020 layer. Alto Patache and Quillagua fall inside the dataset’s Atacama Desert ecoregion. Compare the examples on the same ecological map, then look separately at a map of rainfall or elevation.
A scientific review of the driest terrain focuses on a narrower slice of the desert and the landforms that preserve its climate history. It is not proposing a legal or ecological boundary. Chile’s administrative Atacama Region is yet another unit: a political map labels it for a different purpose. Before comparing two outlines, check which feature each was drawn to represent.
Frequently Asked Questions
Is the blooming desert a sign that the dry core is turning green permanently?
No. Bloom events can follow unusually wet conditions, especially on the southern side. NASA’s Landsat images show a 2026 episode south of Copiapó. The satellite scenes document that event, not a permanent change in the desert boundary.
What kind of map shows where the desert ends on the ground?
An ecological layer shows where its compilers separate desertscrub or other desert vegetation from neighboring environments. A high-resolution relief map shows ridges and valleys but not an exact climate edge. For an individual location, check the ecological classification together with nearby observations and elevation.
Is the Central Depression another name for the Salar de Atacama?
No. The Central Depression is a broad lowland between mountain belts. The Salar de Atacama is a specific salt flat and enclosed drainage basin farther east, between the Domeyko precordillera and higher Andes. Both can appear light on aerial imagery, but the labels describe different features.
What Did We Learn Today?
The Atacama is not equally dry from the Pacific coast to the Andes. At Alto Patache, fog supplies moisture; Quillagua pairs a remarkably low historical rain average with a river; and snow can fall high at Chajnantor. The mapped ecoregion explains where landscapes change, not where all water stops.
Sources & Data Notes
Original GeographyPin atlas uses Natural Earth public-domain coastline and land borders, Mapzen elevation tiles, and RESOLVE Ecoregions 2017 (Dinerstein et al., CC BY 4.0; excerpted and recolored). Mapzen elevation was sampled along 22°S and is vertically exaggerated. Chile’s Environment Ministry 2020 layer corroborates the four named site classifications. Those point checks do not assign an entire municipality. Multiyear Alto Patache fog collectors and published regional climate-station studies record different quantities and periods; they are not a single coast-to-plateau weather survey. Chile’s congressional library provides drainage context, ALMA documents Chajnantor’s elevation and snow, and NASA Landsat imagery documents the 2026 flowering example.
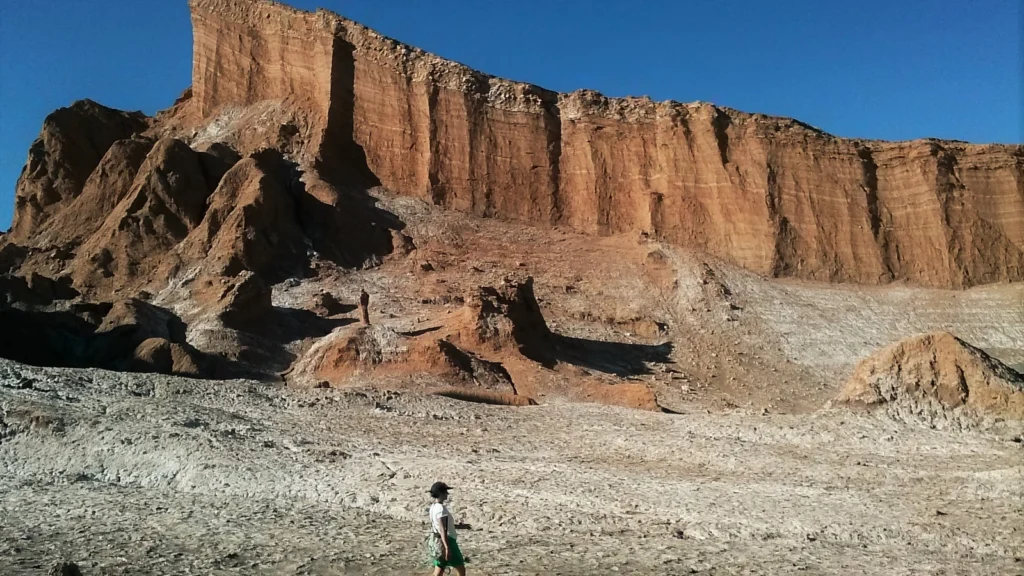
Photo: Valle de la Luna by Lgjunior, 2016, CC BY-SA 4.0 (cropped and resized, same terms). Map data: Natural Earth, Mapzen Terrain Tiles, RESOLVE Ecoregions 2017, Dinerstein et al. (CC BY 4.0; selected features and colors adapted).