A country map tells you where borders run. A physical map of Africa asks different questions: where the land rises, how rivers find their outlets, and why neighboring landscapes can have very different water and vegetation patterns. Reading those layers together reveals a continent of mountain fronts, plateaus, river basins, deserts, forests, wetlands and densely connected cities.
Africa spans the Equator between the Atlantic and Indian oceans, with the Mediterranean Sea to the north. Its physical geography includes the Sahara, central river basins, eastern highlands and rift valleys, and southern plateaus. Latitude matters, but elevation, ocean circulation, rainfall seasonality and drainage explain why its landscapes are not uniform.
How to use this article: Begin with reading the relief map, compare the western African transect, or clarify different kinds of regions. The drainage table follows rivers to their outlets.
1. Locate the continent, then choose the right kind of region
Africa extends across both the Northern and Southern hemispheres. The Equator crosses its central part; the tropics cross its northern and southern parts. The Atlantic lies to the west, the Indian Ocean to the east, and the Mediterranean separates the northern coast from Europe. In the northeast, the Red Sea lies between Africa and the Arabian Peninsula.
A mainland outline is not the whole geographic picture. Madagascar lies off southeastern Africa, while other islands occupy the surrounding oceans. Islands can belong to an African statistical or political grouping without sharing the mainland’s terrain or environmental history. A continent-wide map therefore needs enough surrounding water to make their positions intelligible.
Regions depend on the question
The UN’s M49 scheme groups countries and areas into Northern, Western, Middle, Eastern and Southern Africa for statistical purposes. These are not boundaries between climates, languages or landforms. A river basin can cross several countries, and a mountain system can span more than one statistical region.
Keep these layers separate when comparing maps. Use a country map to identify a state, a relief map to understand terrain, and a drainage map to follow water. None is a substitute for the others. A physical map answers different questions from a political map: terrain and drainage patterns do not stop at national borders.
2. Read the plateaus, basins and mountain margins
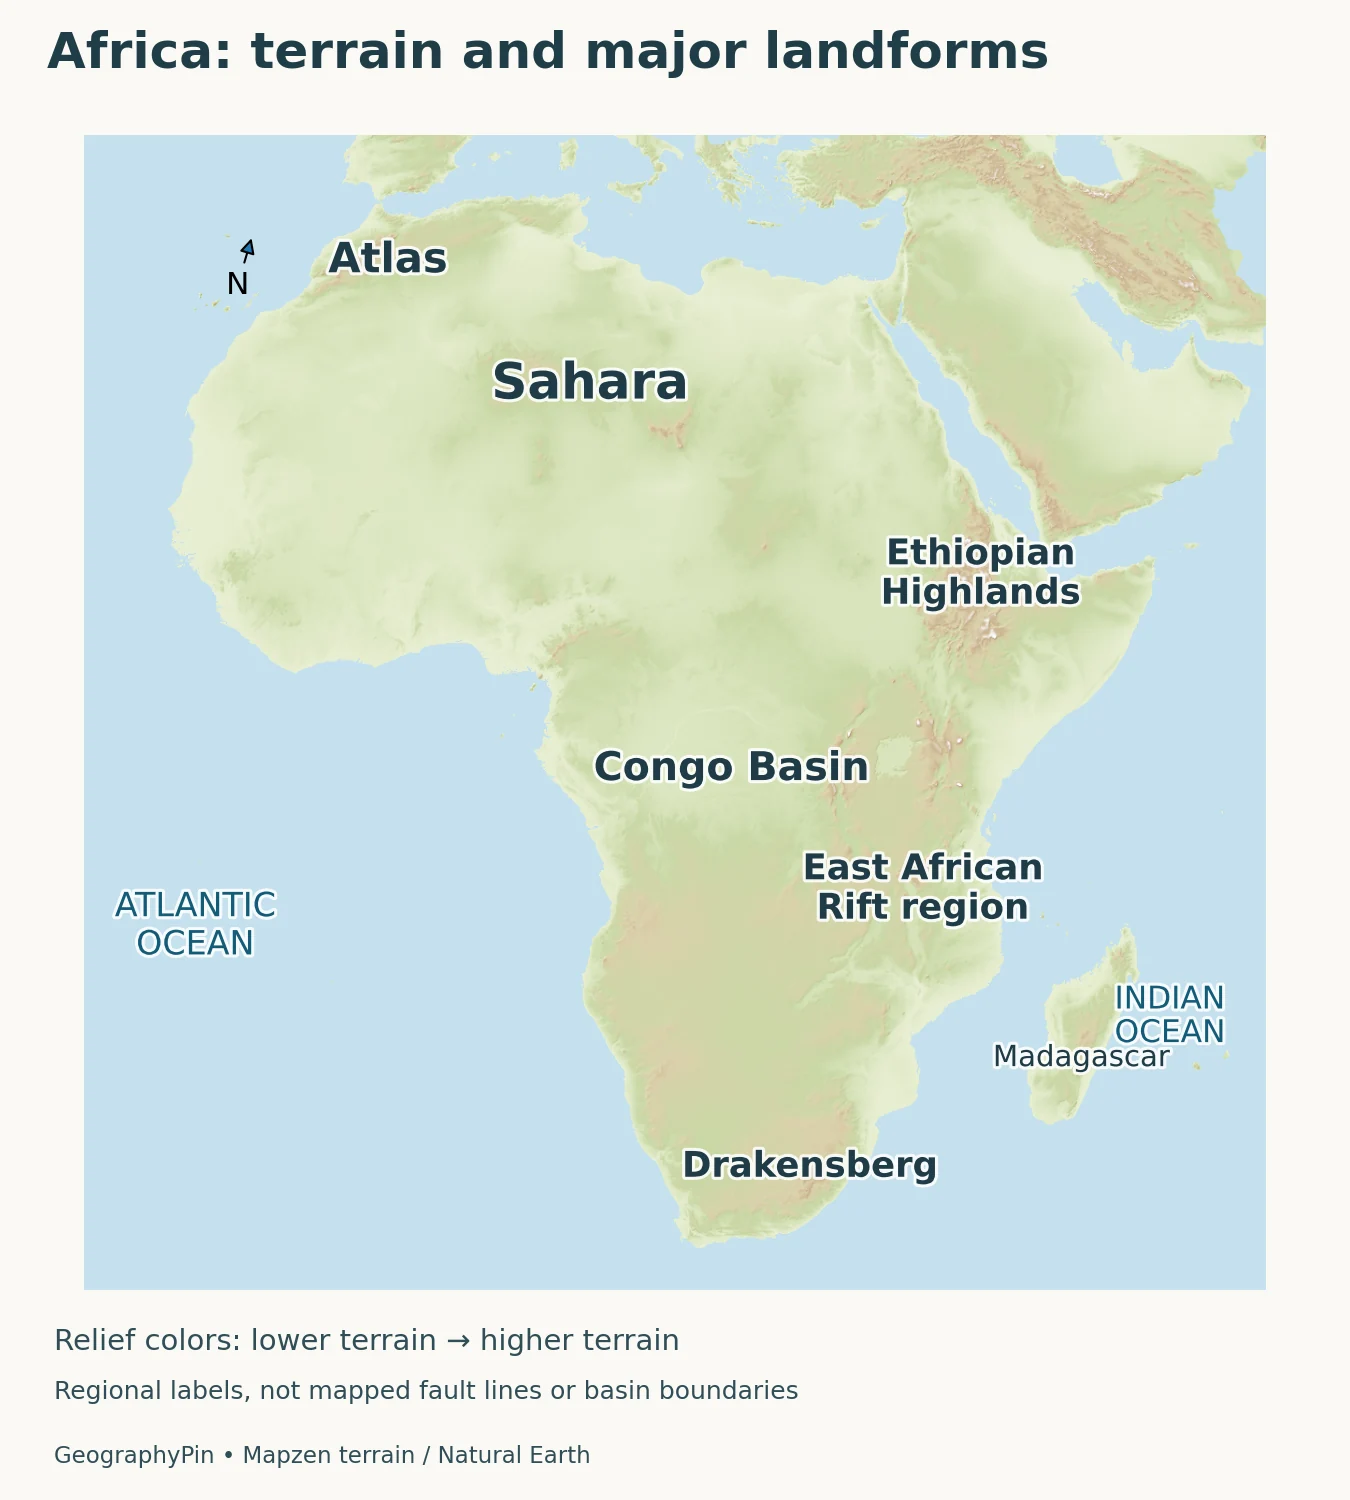
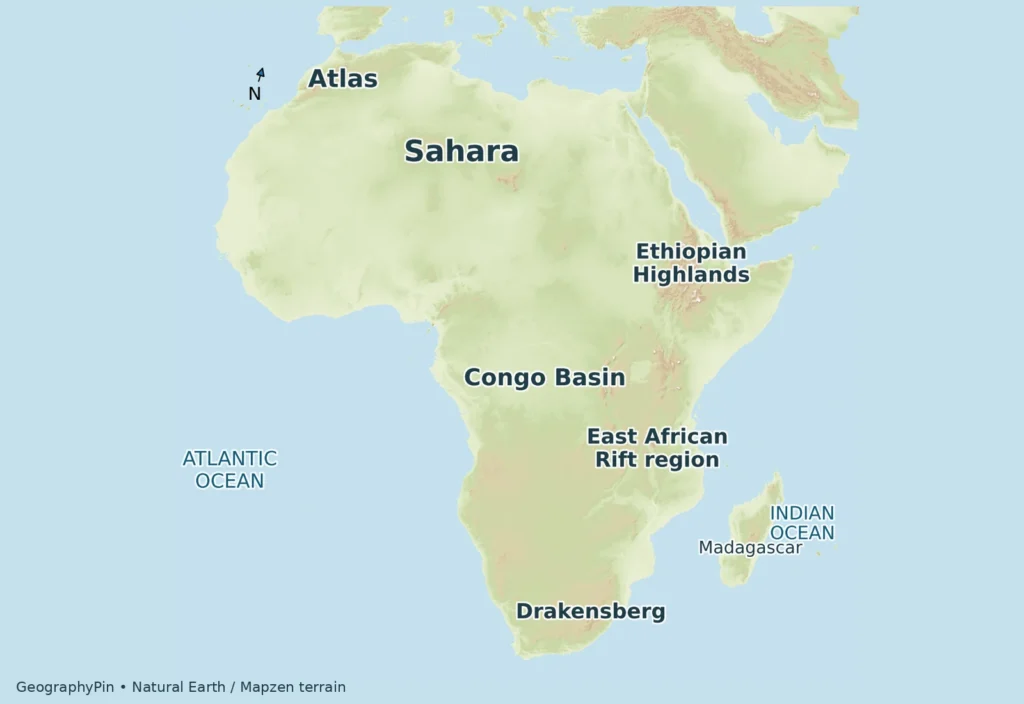
Start with the difference between height and shape. A plateau is elevated country that can contain broad surfaces as well as deeply cut valleys. A basin is a relatively low area receiving drainage from surrounding terrain. A mountain range is not simply any brown patch on a map: the legend determines whether a color represents height, rock type or something else.
In northwestern Africa, the Atlas mountain systems interrupt the idea of a uniformly flat desert margin. NASA’s satellite descriptions of western Algeria and Morocco show rugged ridges and neighboring lower terrain. The Sahara itself includes rocky surfaces, uplands and gravel plains as well as dune fields. Sand dunes are a familiar image of the desert, but they do not describe its entire surface.
Farther south, the Congo Basin provides a major central drainage focus, contrasting with the elevated country of eastern Africa. The Ethiopian Highlands, rift valleys and volcanic landscapes do not form one simple ridge. The USGS describes an extensive rift system developing through faulting, volcanism and crustal extension, with different sectors having different histories.
In southern Africa, elevated interior country meets escarpments and lower coastal terrain. The Maloti-Drakensberg illustrates how a mountain edge also organizes drainage. UNESCO describes a watershed divide along the escarpment, including headwaters feeding the Senqu/Orange system toward the Atlantic. A highland can therefore influence places far downstream, not only communities at its foot.
Reading this relief map
Terrain shading shows relative height and shape, not forest cover or present-day snow. The labels identify selected major features rather than every range. The East African Rift label is regional context, not a mapped active fault trace. For local travel, engineering or hazard decisions, a continental map is too generalized.
3. Climate patterns have transitions and exceptions
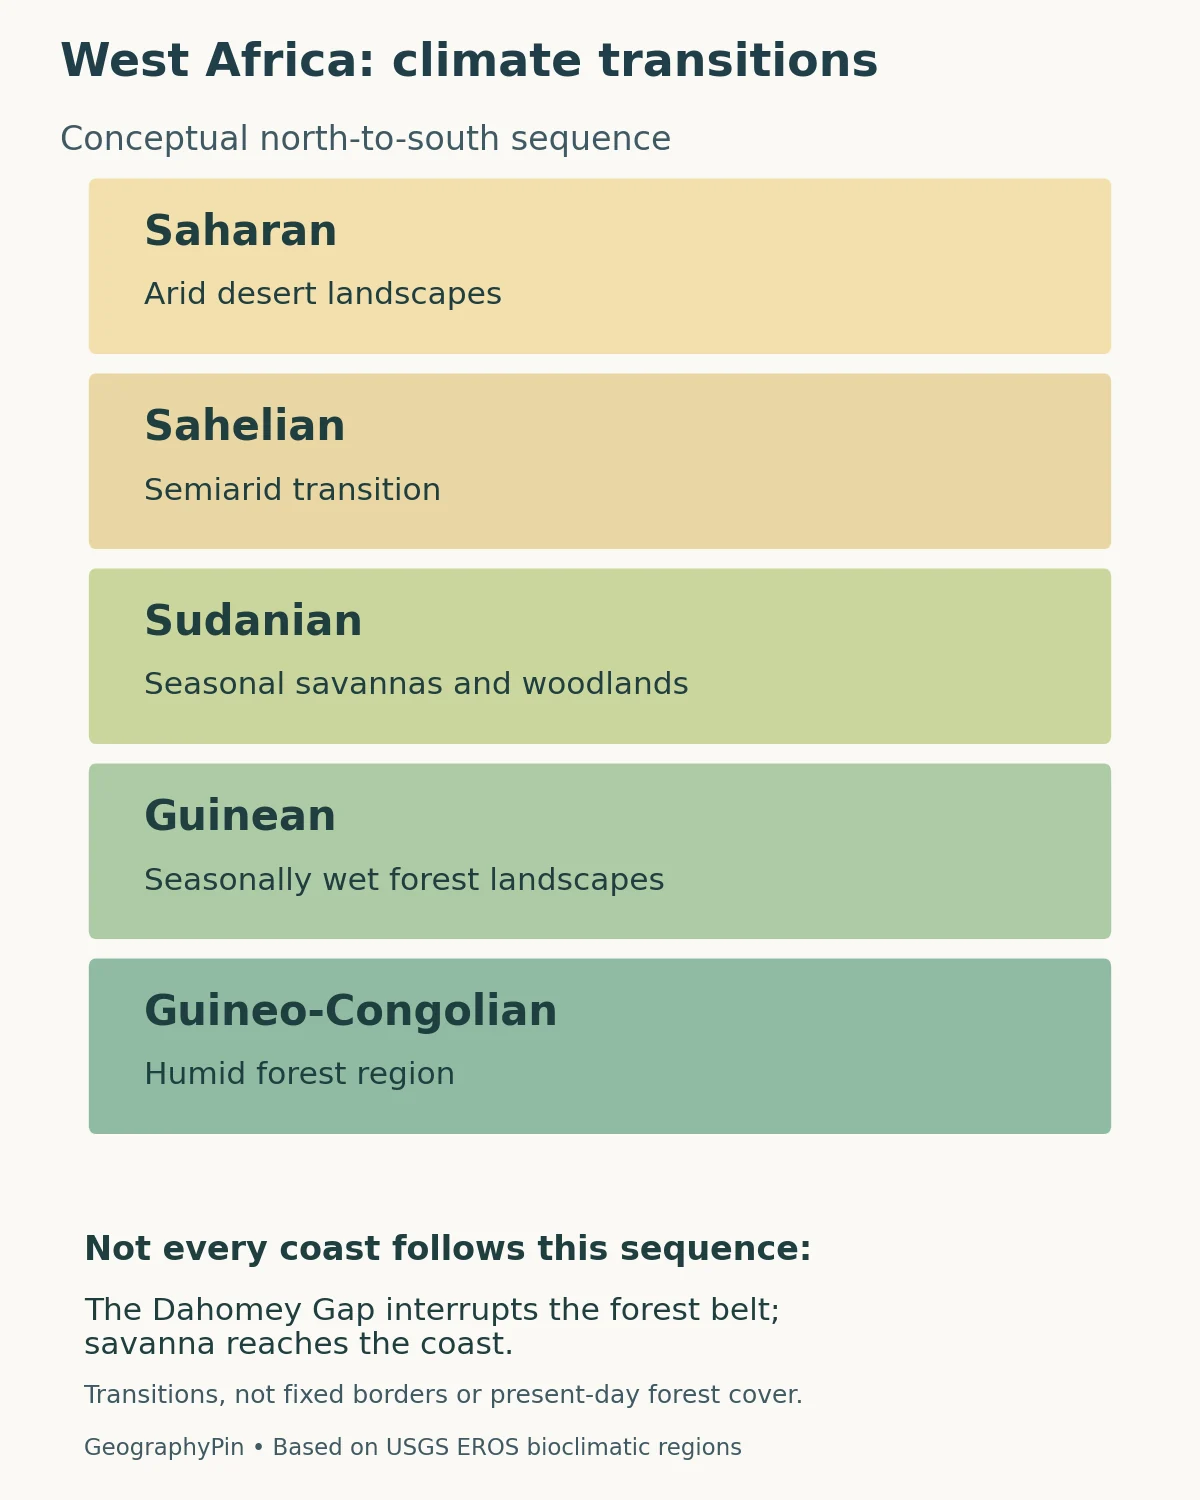
The diagram follows a western African sequence, not a rule for every longitude. The USGS distinguishes Saharan, Sahelian, Sudanian, Guinean and Guineo-Congolian bioclimatic regions. Broadly, this moves from very dry northern landscapes toward wetter southern ones, but the boundaries are gradients rather than walls. The schematic does not assign measured widths or universal rainfall cutoffs.
Names need care here. The Sudanian ecological region is not another name for the modern country of Sudan. Likewise, a Guinean zone is not confined to the country Guinea. Ecological labels and state names can share historical roots while describing different geographic areas.
Even along the southern coast, forest is not one uninterrupted strip. The USGS identifies the Dahomey Gap, where savanna reaches the coast between forest blocks. This is why copying a neat colored belt across the whole continent would misrepresent the evidence.
Elevation and ocean influence add another layer. The Ethiopian highlands and nearby lowlands differ sharply in terrain despite their proximity. On southwestern Africa’s Atlantic margin, cold-water upwelling associated with the Benguela Current helps maintain coastal aridity. Farther inland, different rainfall and terrain settings support different landscapes. Proximity to the sea alone does not guarantee a wet climate.
Seasonality also matters: annual rainfall totals do not tell a reader when water arrives, how long dry periods last, or whether floodwater came from rain far upstream. These distinctions connect climate maps to rivers and wetlands rather than treating the two subjects independently.
4. Follow the rivers, not just the blue lines
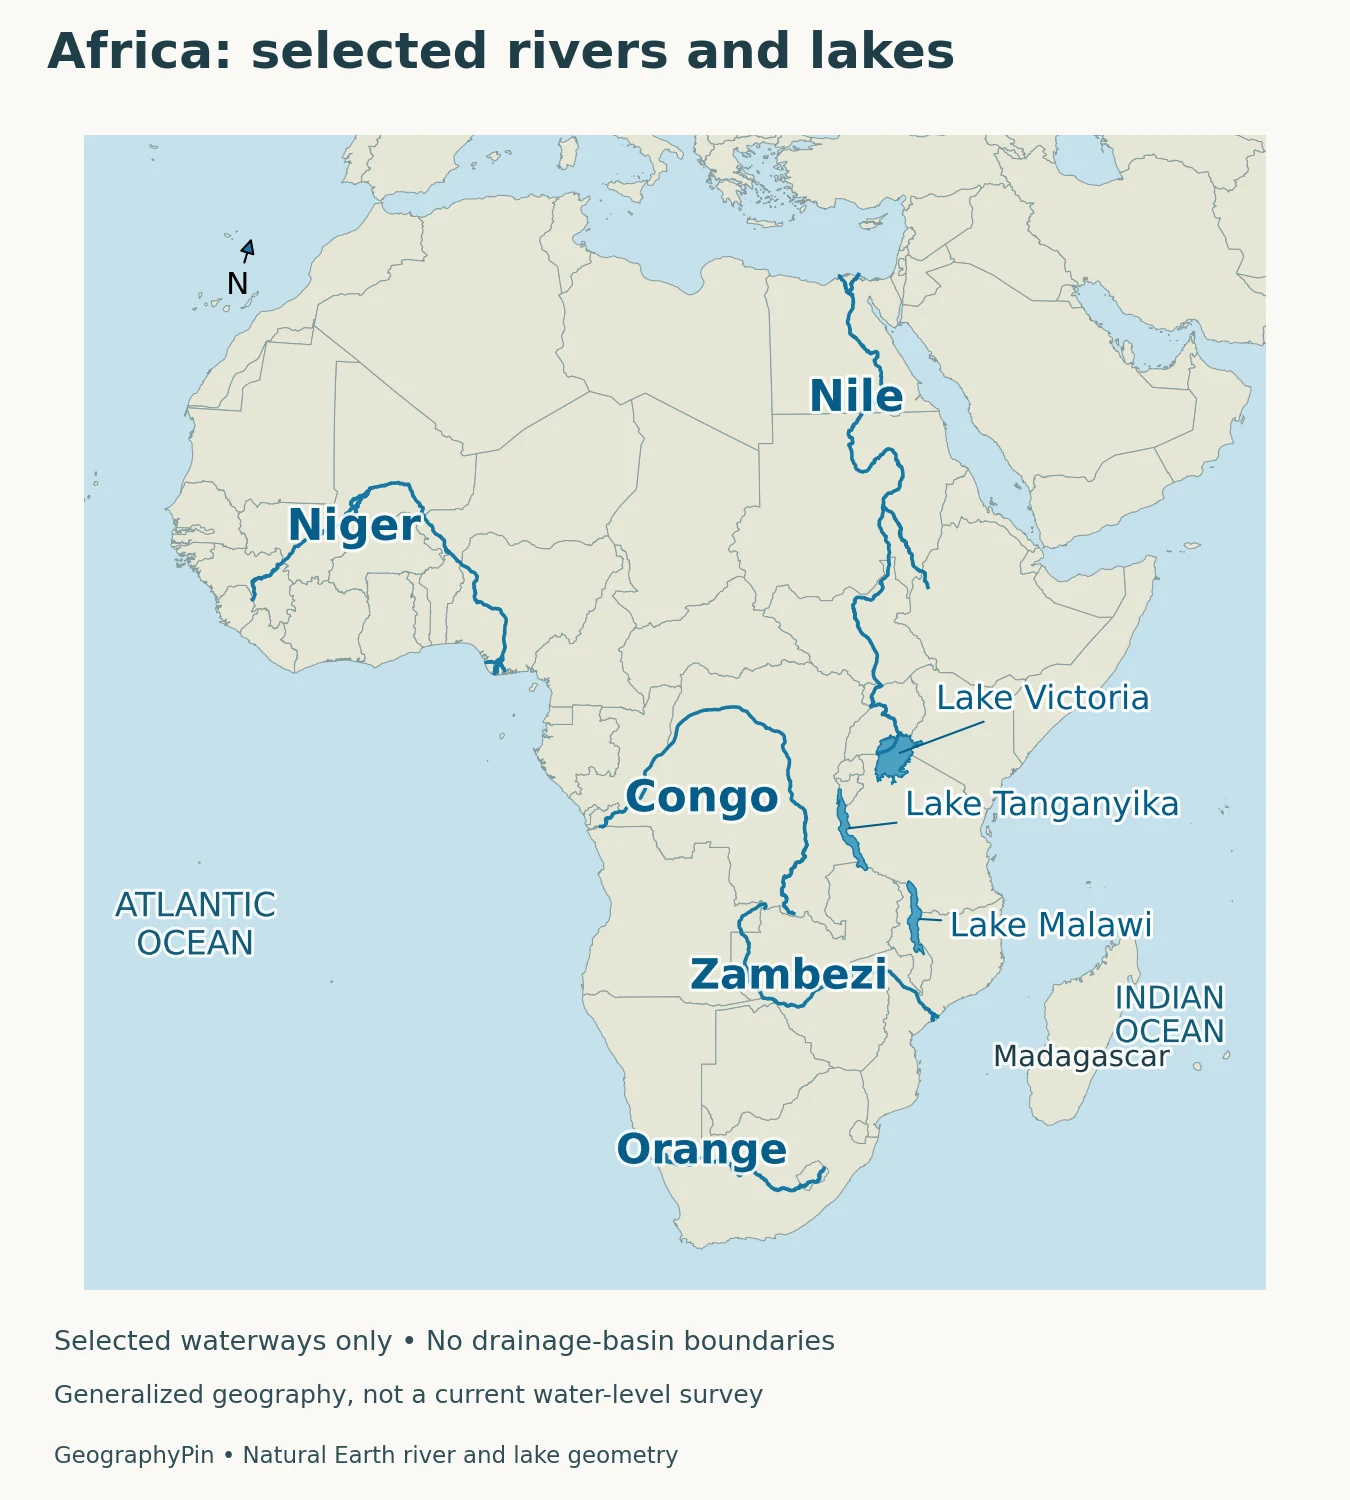
A river map becomes more useful when you ask where the water ultimately goes. Rivers follow gravity through connected channels, but their overall course need not point toward the nearest coast. A watershed includes the land draining toward the river system; it is larger than the main channel and can cross national boundaries.
| River system | Destination | What to notice |
|---|---|---|
| Nile | Mediterranean Sea | Follow the northward lower river separately from its extensive upstream basin |
| Congo | Atlantic Ocean | Connect central African drainage with its western ocean outlet |
| Niger | Gulf of Guinea, Atlantic Ocean | Notice the inland bend before the lower river turns toward the coast |
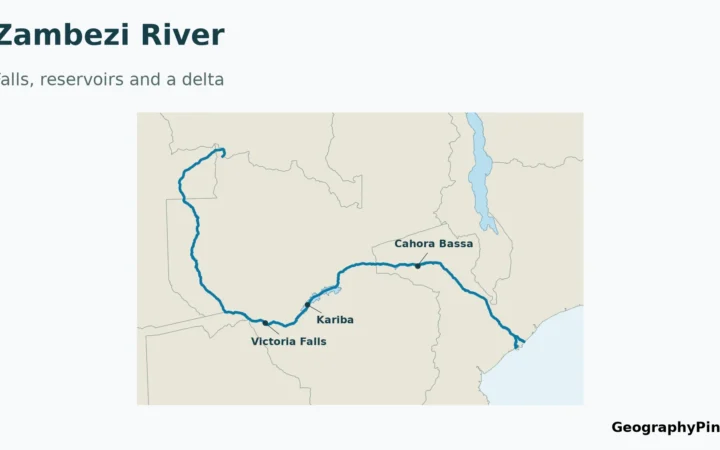
| Zambezi | Indian Ocean through Mozambique | Follow an eastward outlet from the south-central plateau |
| Senqu/Orange | Atlantic Ocean | Connect southern highland headwaters with a western outlet |
| Okavango | Inland wetland system | Do not assume every major river reaches a sea |
The Niger is a particularly useful map-reading example. Its course runs inland before reaching the Gulf of Guinea; its inland delta in Mali is not its coastal delta in Nigeria. A single river can form wetlands in one part of its journey and still continue downstream to an ocean.
The Okavango offers a different lesson. UNESCO identifies its delta in northwestern Botswana as an inland system without an outlet to the sea. Floodwater spreads through permanent marshes and seasonally flooded plains. Its flood pulse can arrive during Botswana’s dry season, showing why local weather and upstream water supply are not interchangeable.
The selected channels and lakes shown here are geographic reference features, not live water conditions. Their presence does not establish current flow, navigability or safe crossings. Dams, seasonal rainfall and water withdrawals can change conditions without changing the broad continental drainage pattern.
5. Compare three named geographic transects
A transect is a route used to compare changing conditions. The following are geographic reading routes, not surveyed elevation profiles or recommended journeys. Their purpose is to connect the map’s features with processes rather than turn Africa into a list of superlatives.
Western Africa: Sahara through the Sahel toward the Guinea coast
Read southward from Saharan landscapes through the Sahel and Sudanian zone toward the wetter coastal regions. The central change is moisture availability and seasonality, not a sudden national-border transition. Use the five-zone diagram as a conceptual guide, remembering the coastal exceptions and the fact that actual vegetation also reflects land use.
Northeastern Africa: Ethiopian Plateau toward the Danakil Depression
Read from the high plateau toward the lower Afar/Danakil landscape. NASA locates the Danakil Depression between the Ethiopian Plateau to the west and the Danakil Alps to the east. Here tectonic extension and pronounced relief matter more than a simple north–south climate-belt explanation. A low depression beside high terrain is not evidence that the entire surrounding region is flat.
Southern Africa: Namib coast toward the elevated interior
Move inland from the Atlantic-facing Namib rather than assuming all coastal land is humid. NASA links the dry coastal setting with cold-water upwelling and contrasts it with wetter inland areas containing large urban concentrations. The comparison shows how ocean conditions, terrain, rainfall and economic history interact; it is not a claim that rainfall alone determines where people live.
These comparisons work because they ask the same questions in different places: what changes in height, water availability and drainage, and which process helps explain the change? They do not require invented numerical cross-sections or sharp environmental boundaries.
6. Settlement is geographic, but not predetermined
Water, terrain and transport affect settlement opportunities, yet they do not provide a complete explanation of population patterns. Trade routes, political decisions, farming systems, infrastructure and economic activity also matter. Describing a dry region as empty, or assuming all large cities must be coastal, hides important geographic relationships.
The USGS West African land-change atlas compared settlements in 1975, 2000 and 2013. It documents both expansion of existing urban centers and growth of smaller towns, including settlement networks extending into arid areas. Those are historical observation dates, not a claim about the exact built-up area today. The evidence also connects changing networks to roads, markets and other social processes.
Southern Africa provides a complementary example. NASA’s account of nighttime imagery identifies inland industrial concentrations associated with mining as well as settlements drawing on the Orange River. Physical setting and economic history belong in the same explanation. A night-light image, however, is not itself a census: brightness also depends on electricity access, land use and the time of observation.
For population comparisons, match the date and geographic unit. A city proper, a continuous built-up area, a metropolitan region and a country are not interchangeable. A regional total can conceal large contrasts within it. The same discipline used to read a drainage basin helps here: first identify the boundary, then decide what a number actually measures.
What Did We Learn Today?
Africa’s physical geography becomes clearer when relief, climate and drainage are read together. Plateaus and mountain margins organize water movement, while rainfall patterns vary with location, season, terrain and ocean influence. The western climate sequence is useful but cannot be copied across the whole continent. Rivers can bend inland, cross borders or end in interior wetlands, and settlement patterns reflect both environmental conditions and human history.
Sources & Data Notes
Regional names serve different purposes: the UN groupings are statistical, while the five bioclimatic regions describe a western African environmental gradient. Historical settlement observations retain their 1975–2013 dates; they are not current population estimates. The three transects are geographic comparisons, not measured elevation profiles.
- UN M49 regions
- USGS West African bioclimatic regions
- USGS East African Rift
- NASA Atlas terrain
- UNESCO Maloti-Drakensberg
- NASA Danakil
- NASA southern African coastal/inland contrast
- NASA Zambezi delta
- UNESCO Okavango
- USGS settlement growth
- ESA Niger delta
- NASA Congo
- NASA Inner Niger delta
- NASA Nile
Original GeographyPin maps use Natural Earth public-domain country, river and lake geometry, and 64 actual Mapzen Terrarium elevation tiles. Terrain sources include USGS SRTM and GMTED2010, and NOAA ETOPO1; see required terrain attribution. The Lambert azimuthal equal-area projection preserves area, not every shape or distance. Reprojected relief uses qualitative height colors and exaggerated artificial hillshade; it is not vegetation, surveyed summit height or mapped fault geometry. Selected rivers omit many tributaries, and no drainage-basin polygons are drawn. The original climate diagram is conceptual, not measured climate boundaries or present-day forest cover.