When is tornado season? The answer changes with location, and a national spring peak can hide very different regional calendars. Comparing all twelve months is more useful than assigning the entire United States one opening and closing date.
U.S. tornado activity generally peaks earlier in the South and later toward the northern Plains and Upper Midwest. Spring and early summer are important, but southeastern activity also extends into cooler months. Tornado season describes a historical concentration of activity, not a fixed boundary outside which tornadoes cannot occur.
How to use this article: Identify your state group, compare monthly patterns, or read how outbreaks affect averages.
1. A Regional Pattern, Not a Fixed Calendar
A climatological season summarizes a recurring pattern across many years. It is not a prediction for a particular afternoon, week or year. NOAA’s National Severe Storms Laboratory describes an earlier spring maximum near the Gulf Coast, a May-to-early-June peak in the southern Plains, and a June-or-July peak farther north.
The analysis below makes that comparison with one fixed sample: 14,773 reported tornado-start records rated F/EF1–5 during 1991–2020. These are not all tornado reports, and they are not a certified count of unique tornadoes.
The Tornado Alley map uses the same input to examine spatial concentration. This page instead asks how records are distributed through the calendar within each region.
2. The Regions and Records Behind the Charts
State groups, not official tornado-season zones
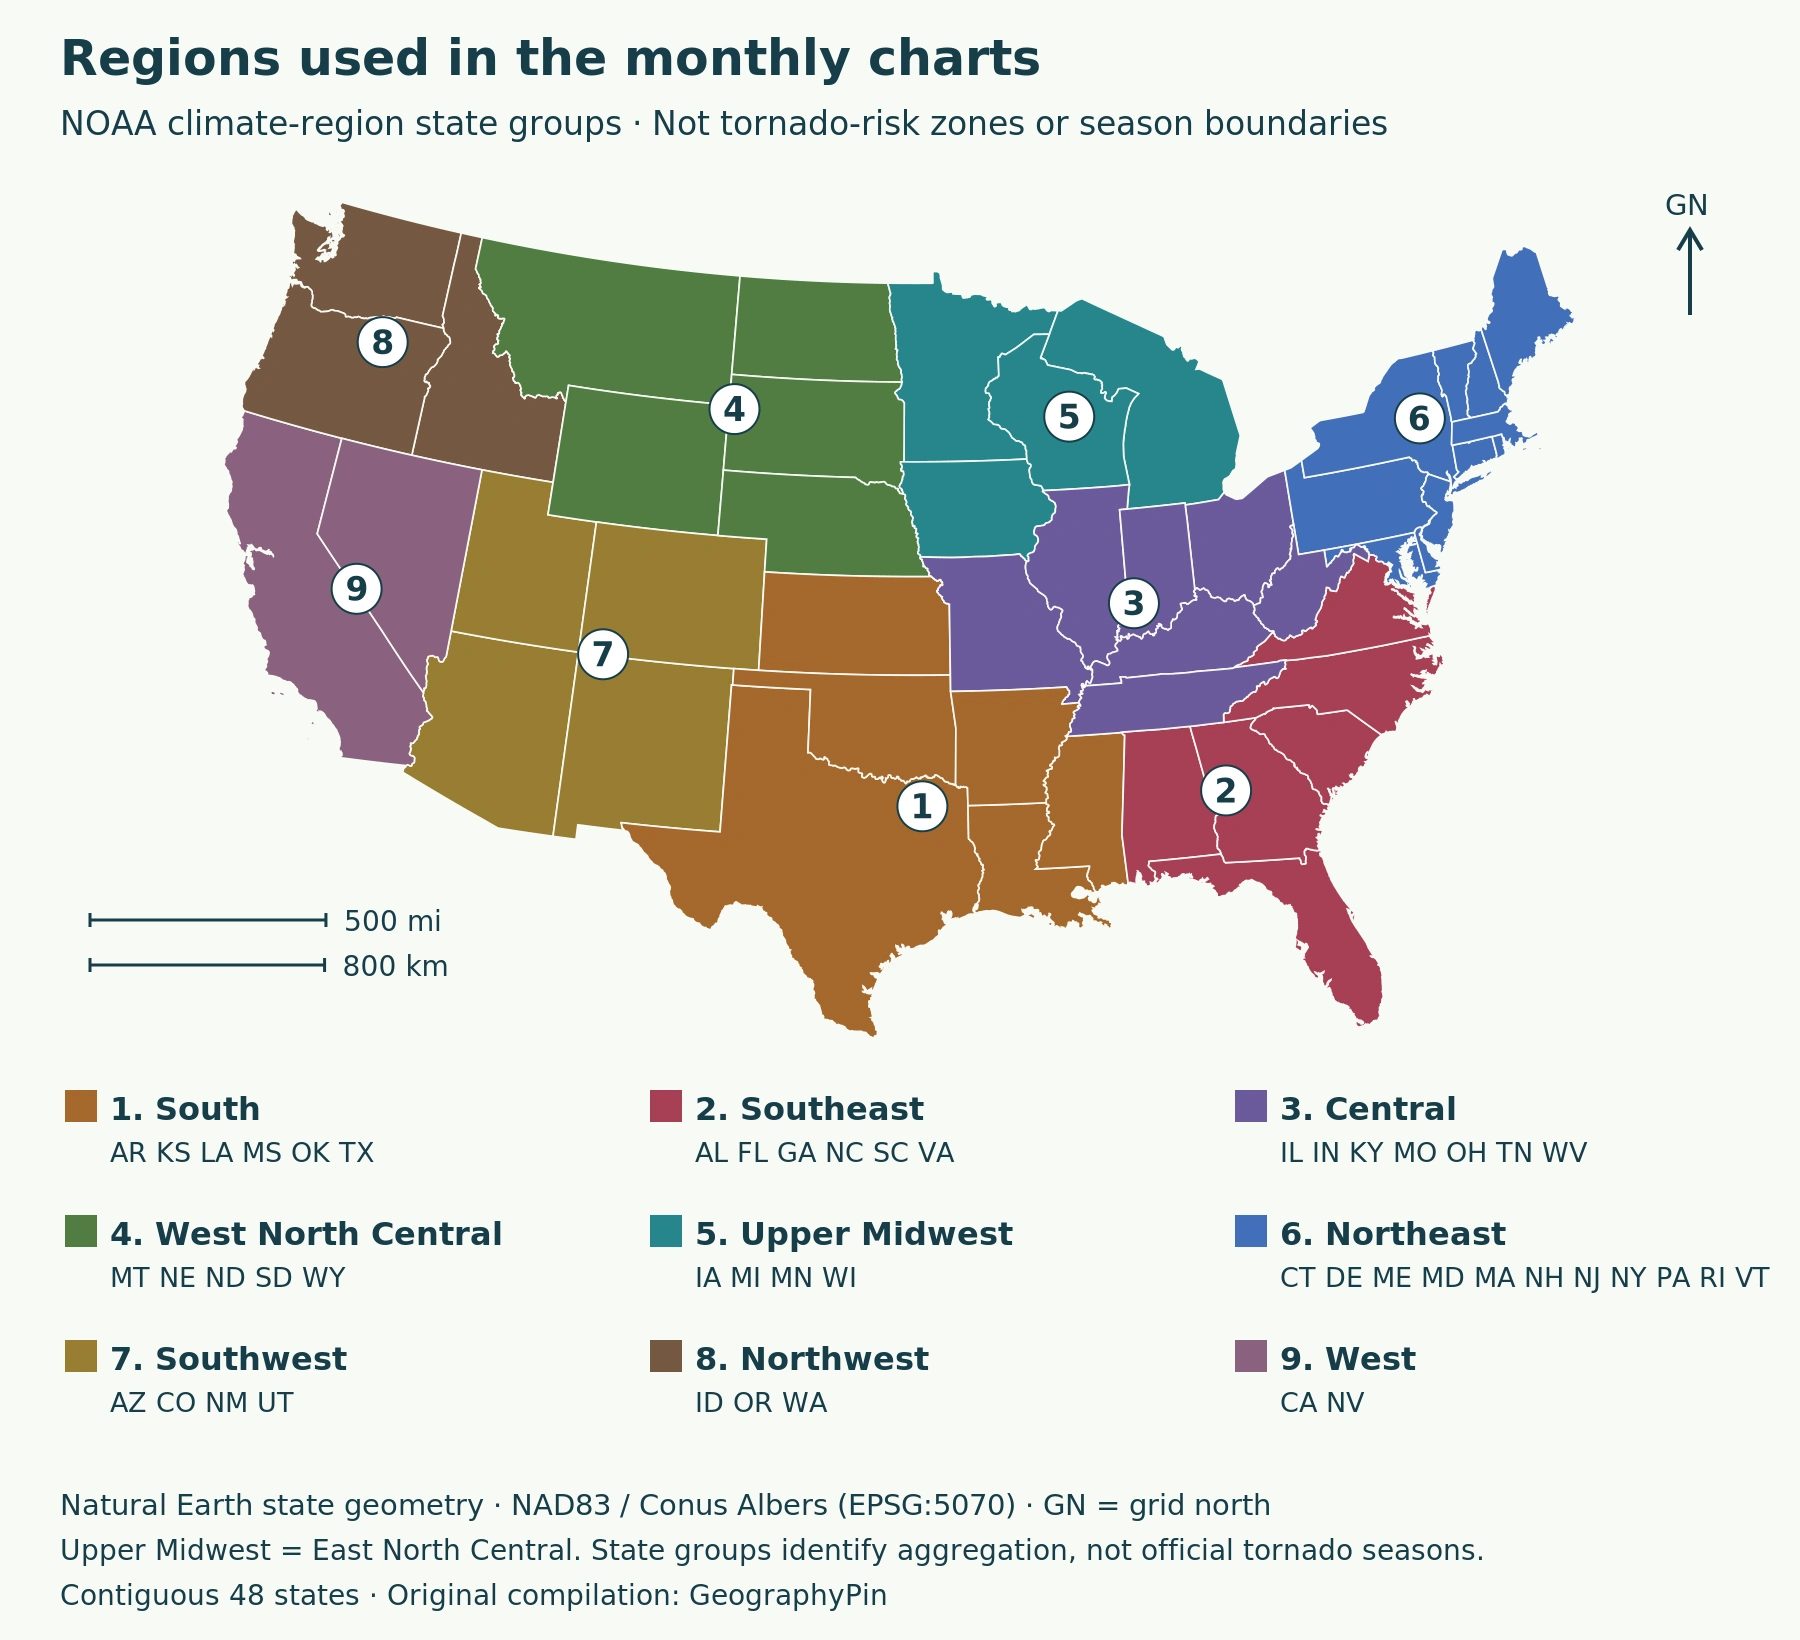
We use the nine state groups documented by NOAA’s Physical Sciences Laboratory. They are climate-summary regions, not tornado-risk boundaries. Their names differ from everyday usage: Mississippi belongs to South, while Tennessee belongs to Central.
On the current NCEI map, Central is Ohio Valley; West North Central is Northern Rockies and Plains; East North Central is Upper Midwest.
The records come from the MRCC/Purdue archive of NOAA/NWS/SPC tornado data. Each row is assigned once using its archived state and month. The selection excludes F/EF0 and unknown ratings. Repeated identifiers were investigated but distinct records were retained, matching the Alley analysis.
Chart calculation: records in one calendar month divided by the region’s full 30-year record total, multiplied by 100. A monthly annual mean instead divides that month’s count by 30. Neither calculation gives the probability that a town or person will experience a tornado.
3. Monthly Patterns Across the United States
Compare timing within a region
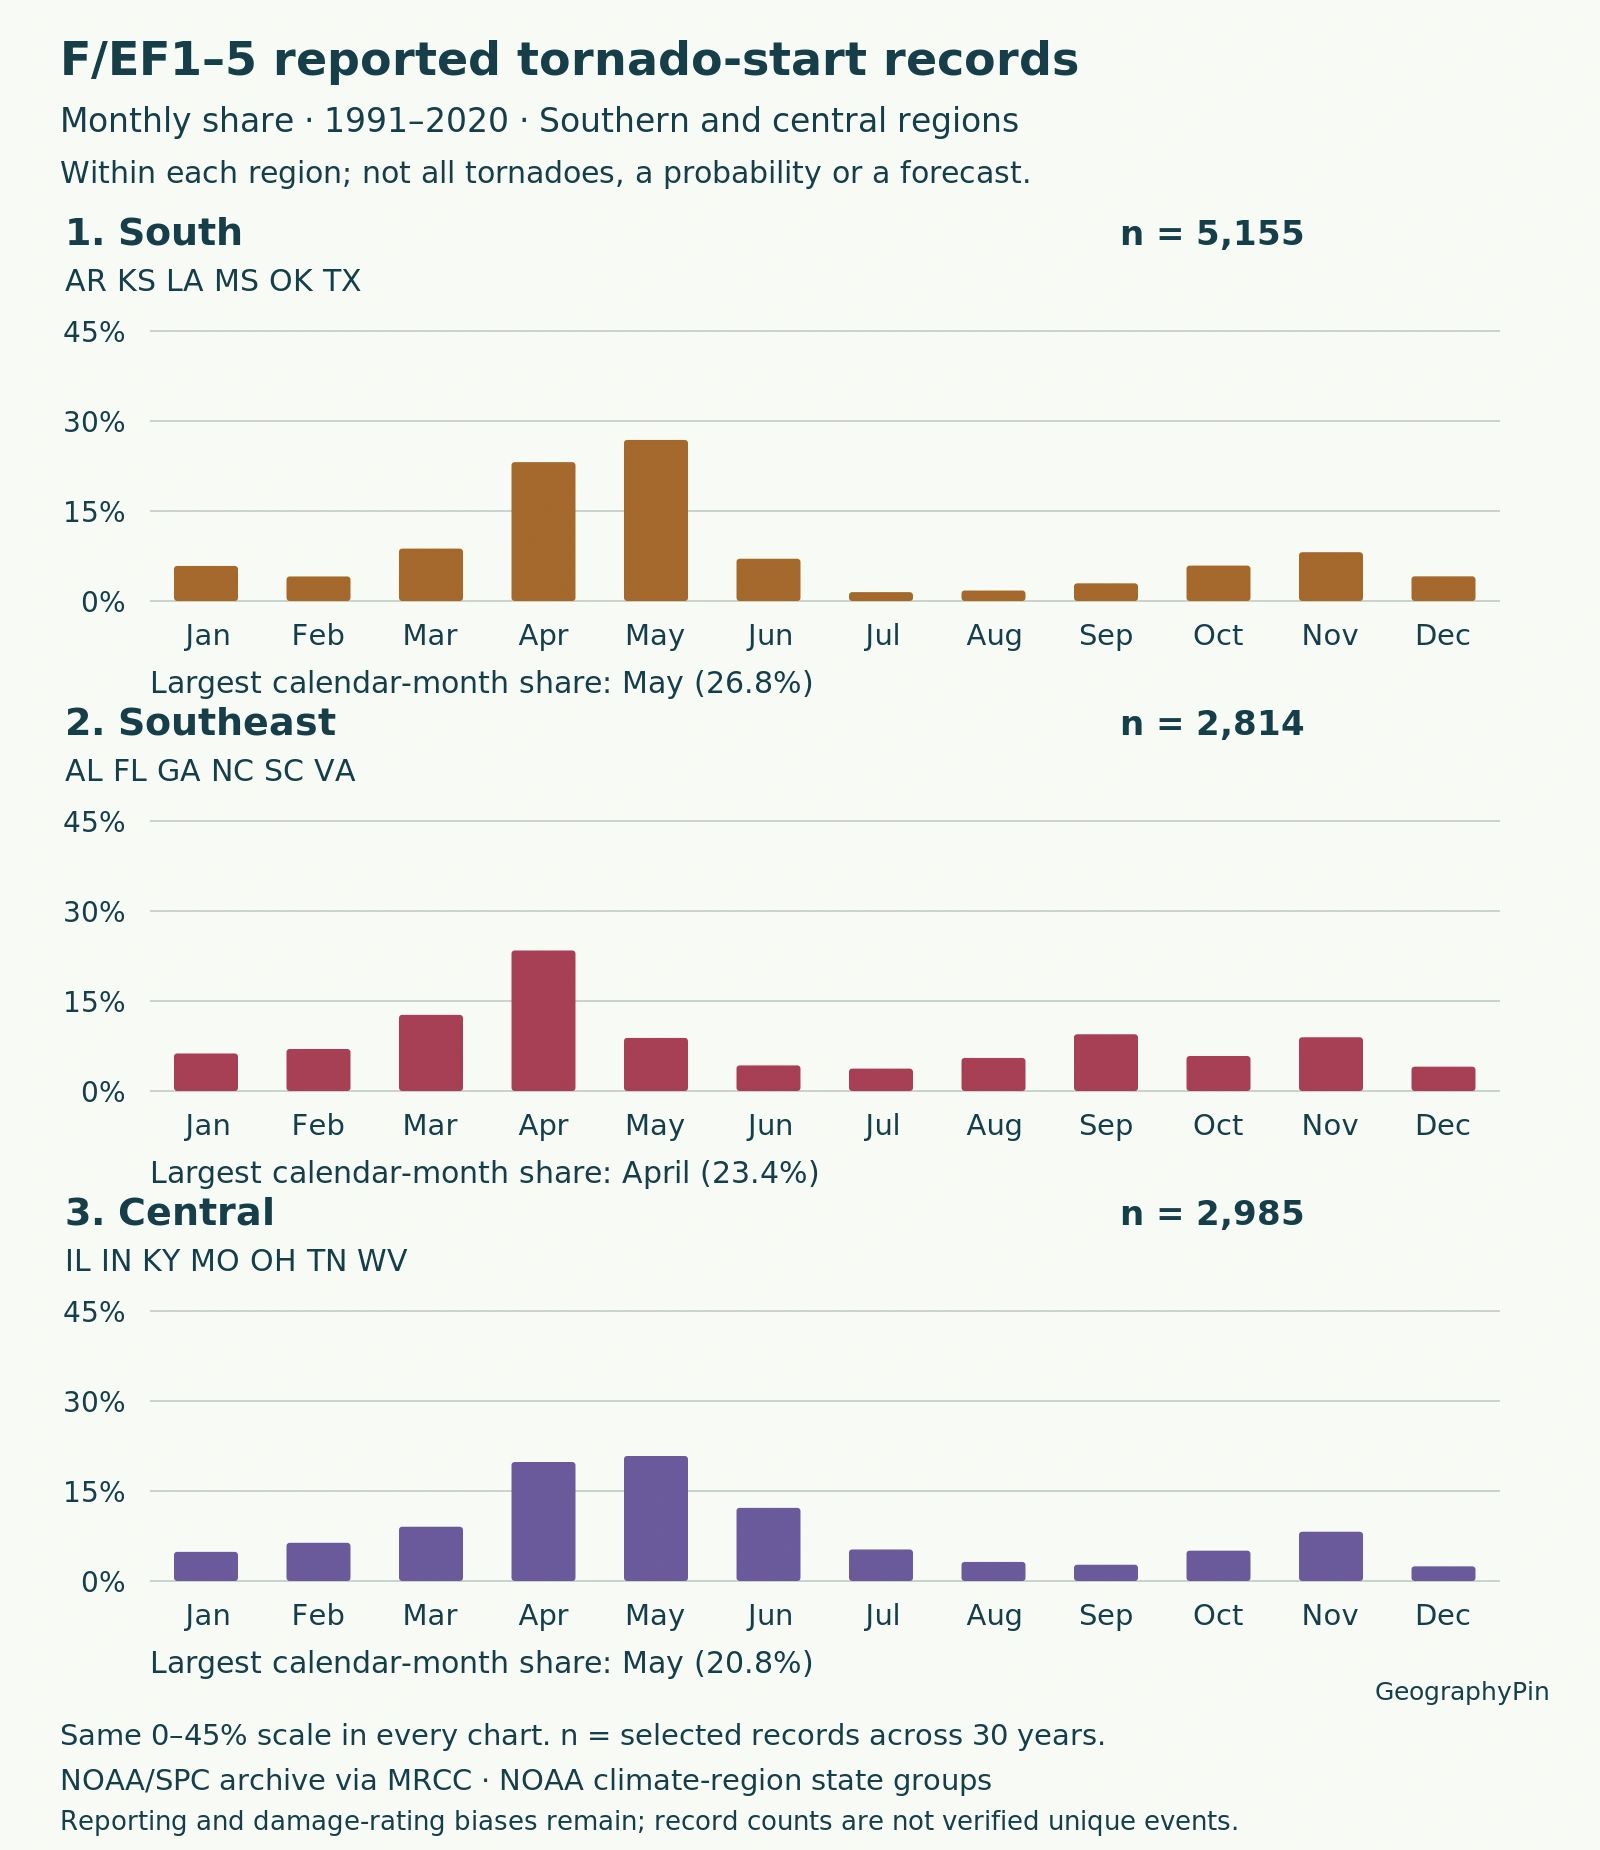
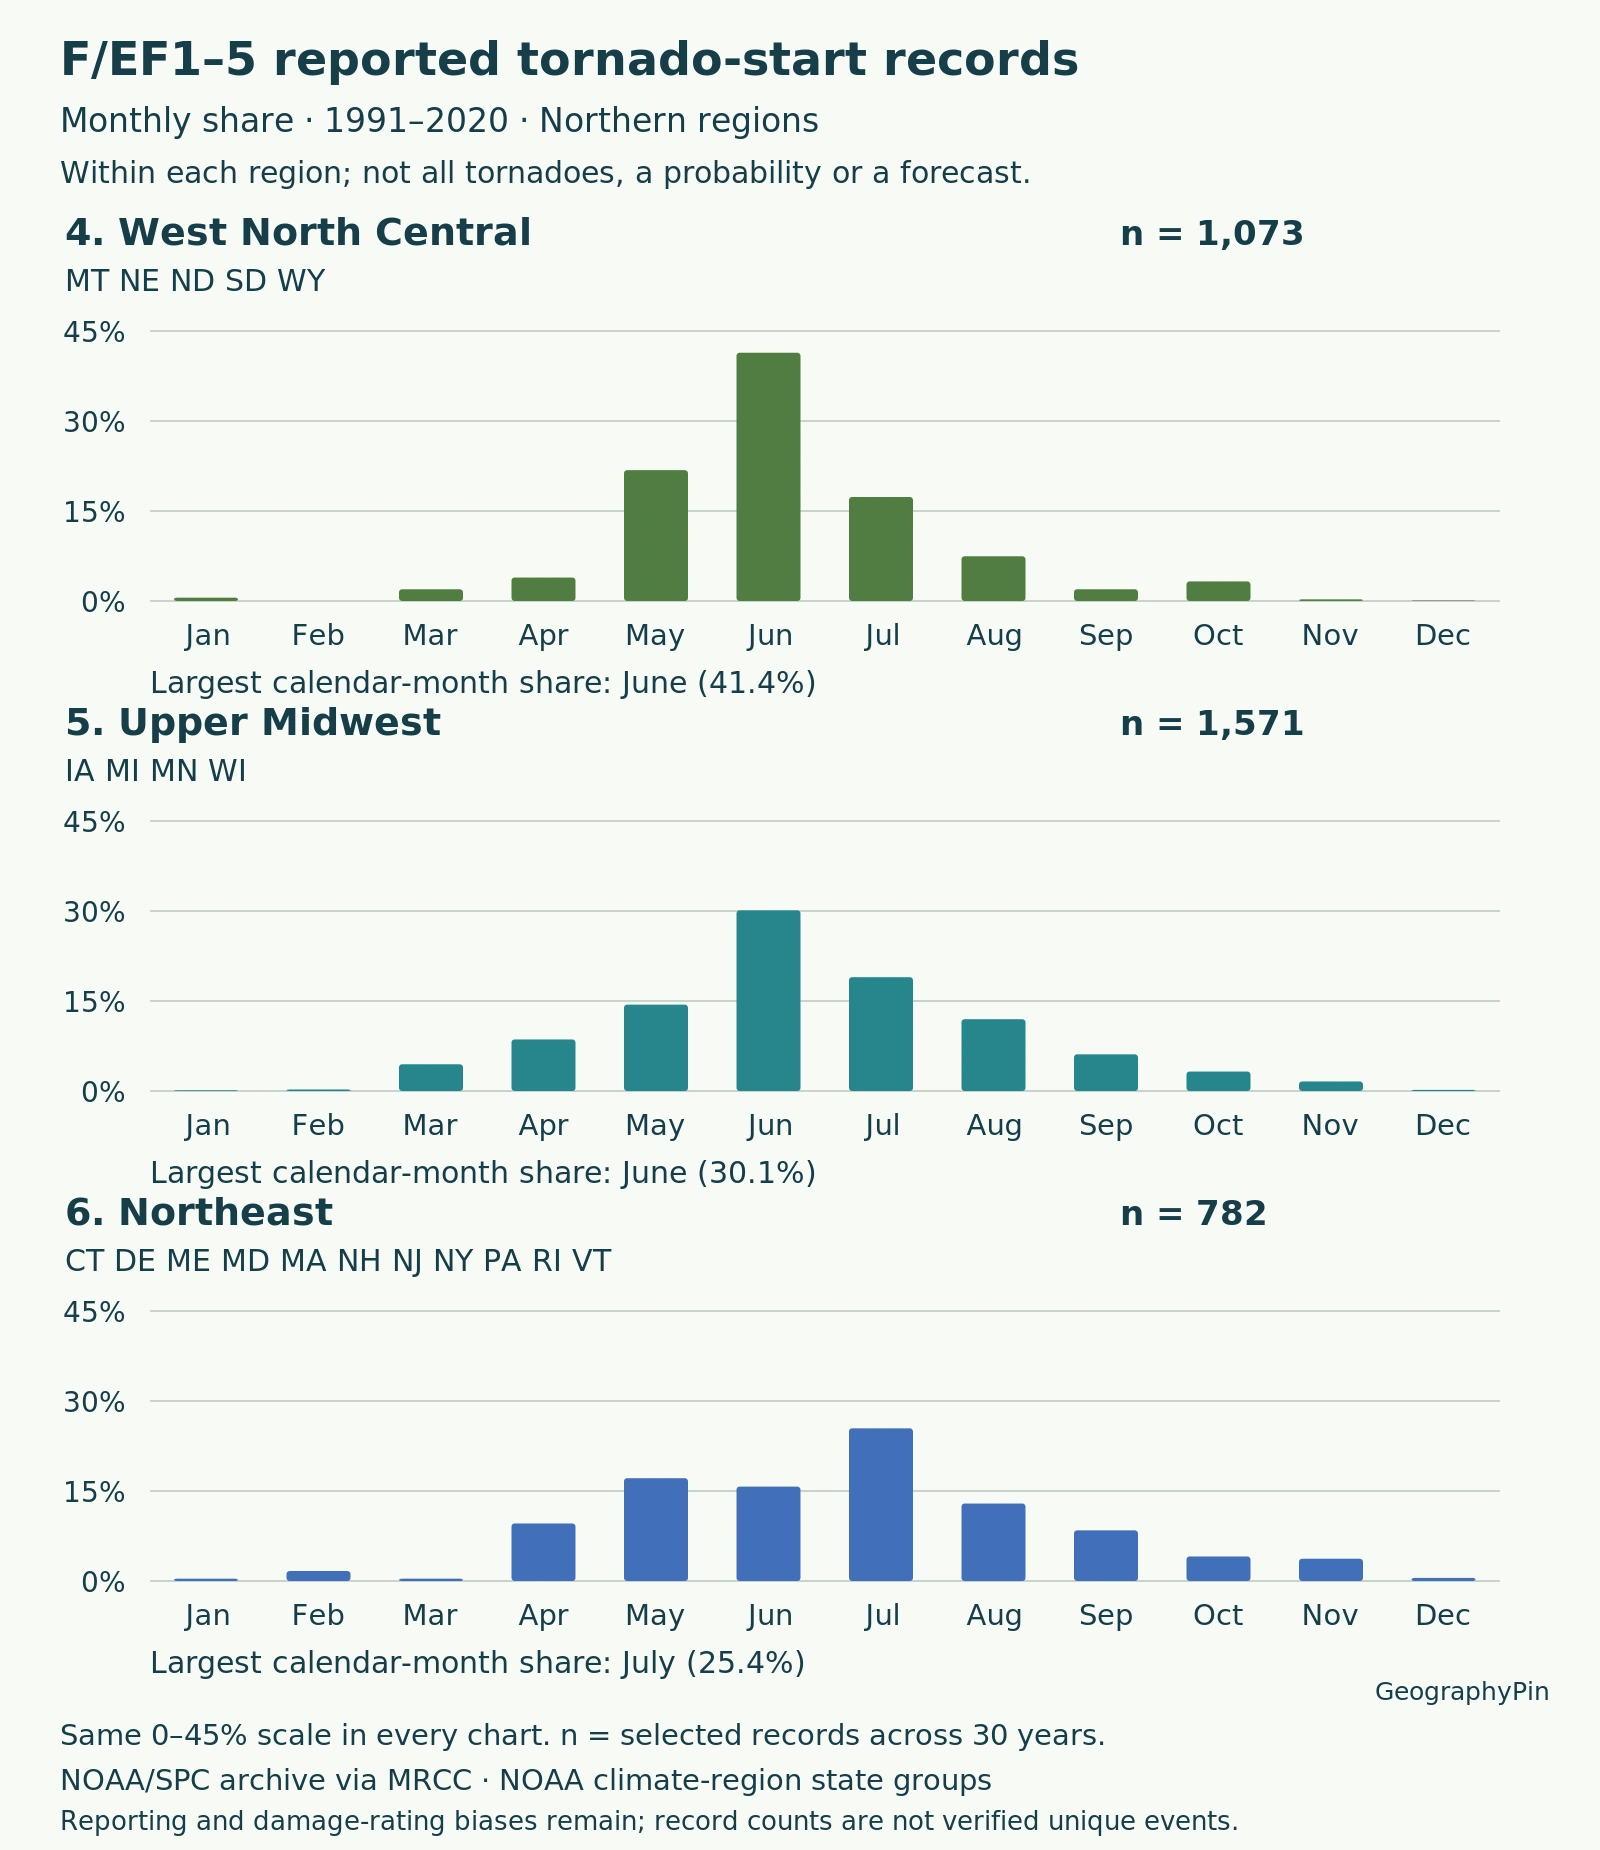
The charts use the same percentage scale. A taller bar means that month contains a larger share of its own region’s selected records, not that the region has more tornadoes than another region. The sample totals remain visible because a percentage based on a few dozen records is different evidence from one based on thousands.
| Region | States | 30-year records | Peak month |
|---|---|---|---|
| Northeast | CT DE ME MD MA NH NJ NY PA RI VT | 782 | July |
| Upper Midwest (East North Central) | IA MI MN WI | 1,571 | June |
| Central | IL IN KY MO OH TN WV | 2,985 | May |
| Southeast | AL FL GA NC SC VA | 2,814 | April |
| West North Central | MT NE ND SD WY | 1,073 | June |
| South | AR KS LA MS OK TX | 5,155 | May |
| Southwest | AZ CO NM UT | 259 | June |
| Northwest | ID OR WA | 55 | May |
| West | CA NV | 79 | December |
In this sample, South and Central peak in May, Southeast in April, and Upper Midwest and West North Central in June. Northeast peaks in July. These are regional maxima across the whole period, not promises about every state or every year.
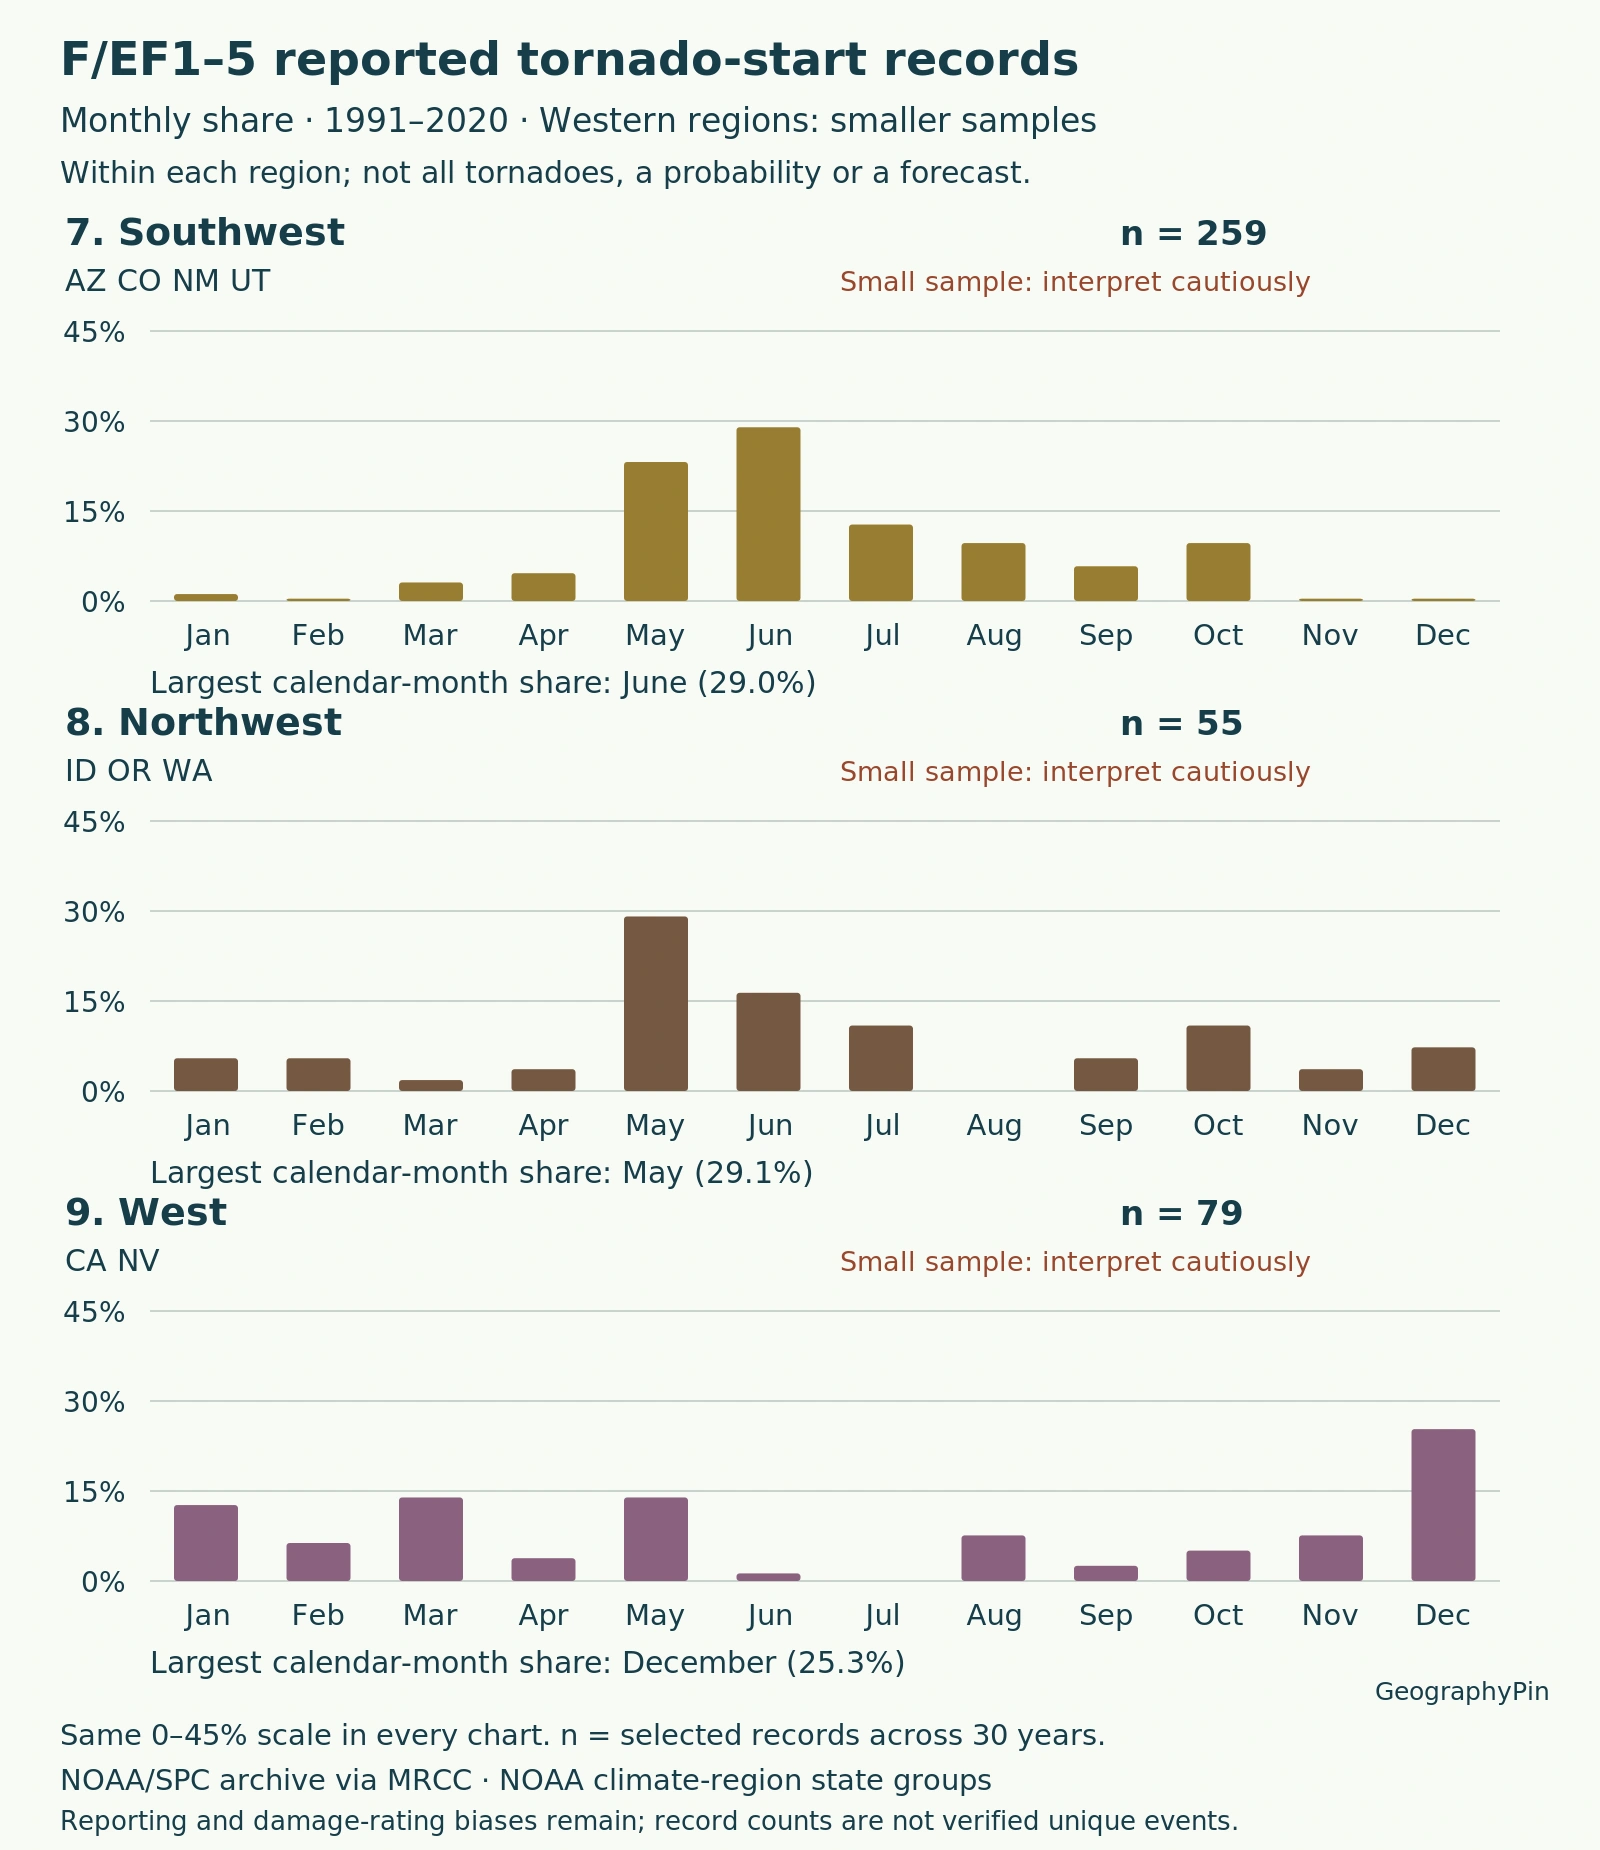
The western samples need particular restraint: Northwest has only 55 records, and West has 79. West’s highest month is December, with 20 records. That small sample does not justify a sweeping “western tornado season” rule.
| Region | Jan | Feb | Mar | Apr | May | Jun | Jul | Aug | Sep | Oct | Nov | Dec |
|---|---|---|---|---|---|---|---|---|---|---|---|---|
| Northeast | 3 | 13 | 3 | 75 | 134 | 123 | 199 | 101 | 66 | 32 | 29 | 4 |
| Upper Midwest (East North Central) | 2 | 4 | 70 | 135 | 226 | 473 | 298 | 188 | 96 | 51 | 25 | 3 |
| Central | 145 | 190 | 270 | 592 | 622 | 364 | 157 | 95 | 81 | 151 | 245 | 73 |
| Southeast | 176 | 197 | 357 | 659 | 249 | 120 | 105 | 155 | 266 | 164 | 252 | 114 |
| West North Central | 6 | 0 | 21 | 42 | 234 | 444 | 186 | 80 | 21 | 35 | 3 | 1 |
| South | 301 | 211 | 450 | 1,193 | 1,384 | 363 | 76 | 90 | 152 | 304 | 419 | 212 |
| Southwest | 3 | 1 | 8 | 12 | 60 | 75 | 33 | 25 | 15 | 25 | 1 | 1 |
| Northwest | 3 | 3 | 1 | 2 | 16 | 9 | 6 | 0 | 3 | 6 | 2 | 4 |
| West | 10 | 5 | 11 | 3 | 11 | 1 | 0 | 6 | 2 | 4 | 6 | 20 |
For example, Southeast has 659 April records out of 2,814 overall: 23.4% of its sample. Dividing 659 by 30 gives about 22 April records per year, averaged across the region. It does not mean every April produced 22.
Download the 108-cell monthly data table (CSV) and the calculation method and limitations (TXT). Full-size charts open when selected.
4. Why the Peak Changes with Latitude
NSSL’s tornado FAQ connects the earlier southern and later northern season to the northward progression of spring. This is a broad climatological tendency, not a single storm belt moving smoothly from one state to the next.
Thunderstorms require moisture, unstable air and a lifting mechanism. Unstable air can continue rising after an initial lift. Wind shear, a change in wind speed or direction with height, can help organize rotating storms. Favorable ingredients must overlap; warm weather alone is not a tornado forecast.
Seasonal changes alter where those combinations occur, while individual weather systems determine the setup on a given day. The regional peaks describe the resulting historical pattern, not proof that latitude alone controls every event.
Hail also has its own geographic and seasonal distribution. The Hail Alley analysis uses a different hazard, threshold and period, so its values should not be mixed with this tornado table.
5. Cool-Season Activity and Outbreak-Heavy Months
A mean is not a typical year
Southeast’s April peak does not erase its other months. The table contains 176 January, 197 February and 252 November records. Lower activity than the peak is still activity.
NOAA’s VORTEX USA research summary highlights southeastern cool-season tornadoes and nighttime linear storm systems. A 2019 study by Anderson-Frey and colleagues also found higher wind shear and lower instability in its southeastern tornado environments than elsewhere in the contiguous United States. That study used a different seven-state definition and 2003–2017 event dataset; its counts are not substituted into our charts.
A few very active periods can strongly shape a monthly average. In our selected data, April 2011 supplies 168 of Southeast’s 659 April records, or 25.5%. That is one April contributing roughly a quarter of the entire 30-year April sample.
The monthly data do not identify the weather mechanism of each record. Some tornadoes occur with tropical cyclones, but a late-summer bar cannot automatically be labeled “hurricane tornadoes.” The hurricane–tornado comparison explains that relationship separately.
6. What This Analysis Cannot Tell You
- Not an all-intensity census. F/EF0 and unknown ratings are excluded. This threshold does not remove all reporting bias.
- Not uniform wind measurements. The Enhanced Fujita scale replaced the original scale in February 2007. Ratings use damage-related wind estimates; the combined F/EF selection is not a continuous instrument record.
- Not complete observation. NWS Greenville-Spartanburg explains that severe weather can go unobserved or unreported and that historical reports contain uncertainty. Detection and surveys have changed.
- Not unique-event certification. Two year-and-ID keys are reused in the archive. One pair has different dates; another Florida pair ten minutes apart may reflect segmentation. Distinct rows remain in the sample rather than being silently merged.
- Not a daily rate. Calendar months have different lengths, and these counts are not divided by days.
- Not local exposure. Large regions hide internal differences. Counts are not normalized by area or population and do not measure full damage paths.
A zero in the table means no selected records in that region-month combination during this period, not that a tornado is physically impossible there. This fixed-period comparison also does not test whether the seasonal distribution has changed over time.
7. Use Current Alerts for Today’s Decisions
For conditions now, use the National Weather Service’s local forecasts and active alerts, not the highest bar in a historical chart.
Under NWS alert guidance, a tornado watch means tornadoes are possible and you should be prepared. A tornado warning means a tornado has been observed or indicated by radar: take shelter promptly in an interior room on the lowest floor of a sturdy building, away from windows. Follow local instructions regardless of the month.
What Did We Learn Today?
Tornado season is a regional pattern, not a nationwide deadline. Comparing the same years and ratings reveals differences in timing, but the result depends on region definitions, sample size and outbreak concentration. Monthly shares describe a historical record; they do not replace current alerts or establish a risk-free month.
Sources & Data Notes
GeographyPin calculated the tables from the frozen 1991–2020 F/EF1–5 input retrieved November 17, 2026. Every selected row is assigned once by archived state and month; all 30 years remain in the annual-mean denominator. NOAA climate-region membership supplies grouping only: no temperature-series area weights are applied. Percentages are rounded to one decimal where quoted.
- MRCC/Purdue: NOAA/NWS/SPC tornado archive
- NOAA Physical Sciences Laboratory: climate-region state groups
- NOAA NCEI: current climate-region map and naming aliases
- NOAA NSSL: tornado basics and regional seasonality
- NOAA NSSL: tornado types and wind shear
- Anderson-Frey and colleagues (2019): southeastern tornado environments
- NOAA VORTEX USA: southeastern cool-season research
- NWS Greenville-Spartanburg: severe-weather climatology limitations
- National Weather Service: Enhanced Fujita scale
- National Weather Service: watches and warnings
A tornado near Dodge City, Kansas, on May 24, 2016. This historical photograph illustrates a spring event, not a forecast or current warning. “Dodge City KS Tornado 3” by Lane Pearman, CC BY 2.0; resized and converted to WebP.